Uniswap (UNI/USD) Price is in a Mode of Retracement
Estimated Reading Time: 3 minutes
Don’t invest unless you’re prepared to lose all the money you invest. This is a high-risk investment and you are unlikely to be protected if something goes wrong. Take 2 minutes to learn more
Uniswap Price Prediction – March 2
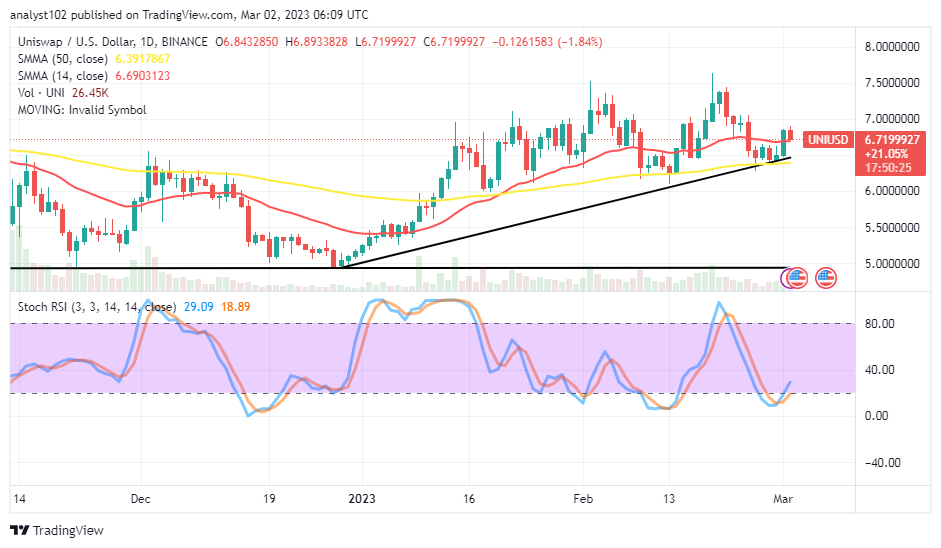
It is on that the UNI/USD market valuation has begun to shift the position against the hands of buyers as the crypto-economic price is in a mode of retracement. Price is trading at an average negative percentage rate of 1.84 to trade around the $6.7199927 point. At this time, it seems the reduction-moving style is to provide buying traits from over the $6 support line.
UNI/USD Market
Key Levels:
Resistance levels: $7.50, $8, $8.50
Support levels: $6, $5.50, $5
UNI/USD – Daily Chart
The UNI/USD daily chart reveals the crypto price is in a mode of retracement against the smaller SMA trend line. The 14-day SMA indicator is at $6.6903123 over the 50-day SMA indicator at $6.3917867. The bullish trend line drew to mark the bottom points from where the price has swung. The Stochastic Oscillators have crossed northbound from the oversold region to 18.89 and 29.09 levels. A bullish candlestick emerged during yesterday’s session to produce a buying path.
What is the crucial turning point for the bullish candlestick in the UNI/USD market?
The critical turning point against the bullish candlestick formed yesterday is around the 50-day SMA trend line, as the UNI/USD price features in a mode of retracement. The indicator’s value line must resist the bears’ ability to drag it farther lower. Thus, long-position placers should be on the sidelines by seizing the opportunity until a little reversal upswing signal resumes.
On the devaluation-moving side of the technical analysis, an instant shorting order alongside the current trading bearish candlestick, at the moment, appears not too ethical. Technically speaking, it would be best to avoid the current slide since, as the stochastic oscillators demonstrate, the velocity ability to the downside is getting close to its minimum values. At this point, 1-hour and 4-hour time frames will complement each other to let buyers observe a decent time to re-launch a longing order position.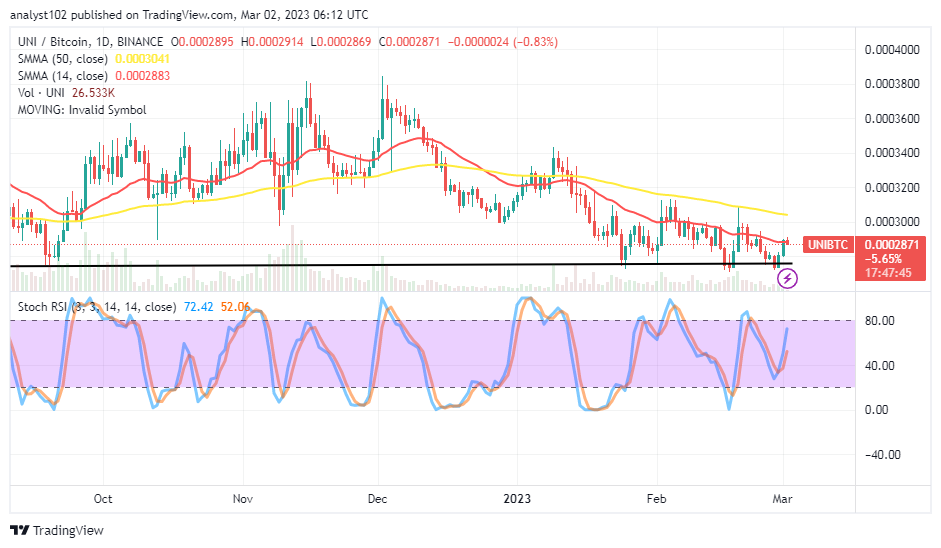
UNI/BTC Price Analysis
Uniswap’s trending capacity, contrasted with Bitcoin, has been striving to muster energy over time as the crypto pair sources in a mode of retracement, having reached the smaller SMA trend line. The 14-day SMA indicator is underneath the 50-day SMA indicator. The Stochastic Oscillators have crossed northbound from 20 and 40 to 52.06 and 72.42. A bearish candlestick is in the making to denote the base crypto is on the verge of risking a debasement. Nevertheless, traders should not overburden their accounts with a high lot size.
Note: Cryptosignals.org is not a financial advisor. Do your research before investing your funds in any financial asset or presented product or event. We are not responsible for your investing results.
You can purchase Lucky Block here. Buy LBLOCK