Tamadoge (TAMA/USD) Is Still on the Trail of $0.0095
Estimated Reading Time: 3 minutes
Don’t invest unless you’re prepared to lose all the money you invest. This is a high-risk investment and you are unlikely to be protected if something goes wrong. Take 2 minutes to learn more
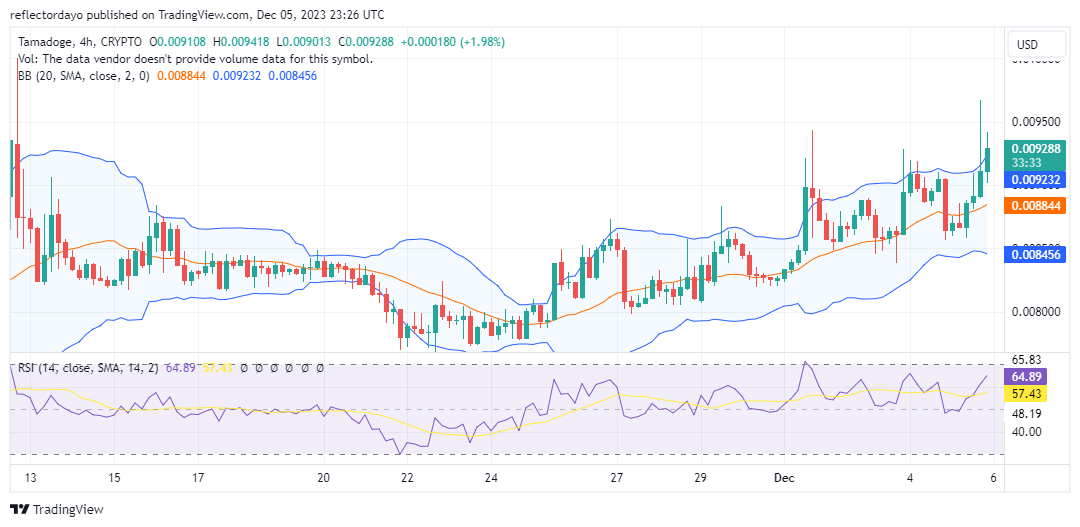
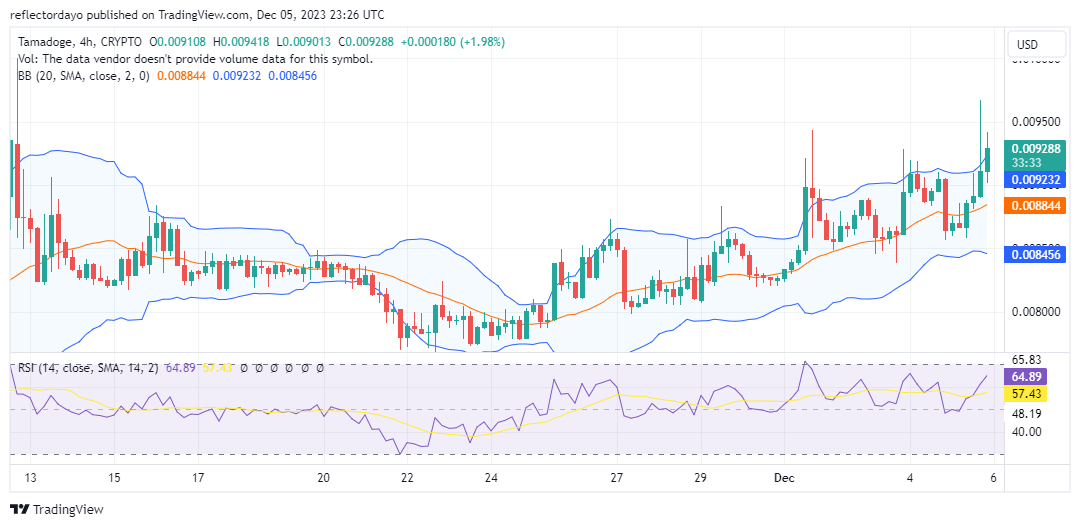
Despite the convergence of bearish traders as the market approaches its $0.00095 price mark, Tamadoge continues to advance closer to its target. This progression persists despite the presence of candlesticks indicating significant bearish activity during the recent 4-hour trading sessions. The prevailing sentiment in the market remains bullish, even as the last 4-hour session tested above the $0.00095 price level. However, the bull market was unable to sustain itself above this threshold.
Key Levels
- Resistance: $0.013, $0.014, and $0.015.
- Support: $0.0075, $0.0073, and $0.007.
TAMAUSD Price Analysis: The Indicators’ Point of View
As Tamadoge continues to exhibit the formation of higher lows, the Bollinger Bands also portray an upward-trending price channel. Additionally, the Relative Strength Index indicates bullish momentum at 62, suggesting that there is potential for further bullish action in this market.
Considering the historical performance of the market, since the mid-September bear market led to a decline from the $0.010 price level, breaching below the $0.0095 threshold, the market has consistently tested the $0.0095 level on multiple occasions. However, the bull market has struggled to sustain itself around this level. The current steady ascent towards the crucial $0.0095 price level indicates a possibility of breaking this resistance, marking a potential shift in market dynamics.
Tamadoge Short-Term Outlook: 1-Hour Chart
The ongoing formation of higher lows is consistently evident in the 1-hour chart analysis of the Tamadoge market. The most recent higher low is materializing at the $0.0091 price level, indicating a notable demand level that may exert pressure on the $0.0095 price level. This pressure could compel bearish traders to reconverge at a higher price point, potentially facilitating the eventual breakthrough of this critical resistance level.
Take control of the Tamaverse by owning a Tamadoge!
Conquer the Tamaverse with your own Tamadoge! 🌟
Level up in our new free-to-play game Tamadogi and perform better across all other Tamadoge games 💪
Download Now 👇
📱 Android: https://t.co/RfZIZOLIDh
📱 iOS: https://t.co/du3iRej7HC pic.twitter.com/BgcxSrGHLY— TAMADOGE (@Tamadogecoin) December 5, 2023
Do you want a coin that will be 100 times more valuable in the next few months? That is Tamadoge. Buy TAMA today!