Uniswap (UNI/USD) Price Moves for Recovery
Estimated Reading Time: 3 minutes
Don’t invest unless you’re prepared to lose all the money you invest. This is a high-risk investment and you are unlikely to be protected if something goes wrong. Take 2 minutes to learn more
Uniswap Price Prediction – May 27
UNI/USD’s market valuation went under falling pressure during about the last five days’ trading operations back. Uniswap’s price now moves for recovery to trade around $27.42 with a less than -6.88% depreciation as of writing.
UNI/USD Market
Key Levels:
Resistance levels: $35, $40, $45
Support levels: $20, $15, $10
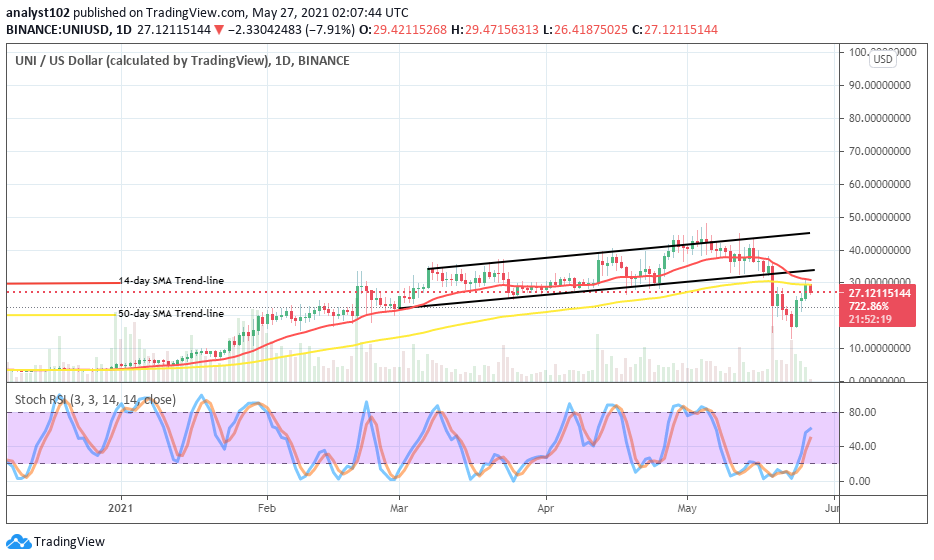
UNI/USD – Daily Chart
The UNI/USD daily chart reveals the pace of price moves for recovery that the crypto has been coming up with against the downward forces it has faced by the US counter trading instrument. On May 24th day trading session, a bullish candlestick emerged to signal the start of recovery moves that the crypto has now commenced. Both the two SMAs are now located outside below the bullish channels. The 14-day SMA trend-line is located closely over the 50-day SMA indicator at around the resistance level of $30. The Stochastic Oscillators have moved up from the oversold region to seemingly attempt closing of hairs within the ranges of 40 and 80. That signifies that price recovery move may soon witness a pause.
Will the UNI/USD be able to get back into the bullish channels?
Going by the pace of the current price recovery moves that the UNI/USD market has put up with, the crypto may soon be facing a line of hovering trading situations as is indicated by the Stochastic Oscillators in the market. The market level at $30 may a bit be difficult for bulls to surge past smoothly in the next active trading operation. However, a sudden downward price reversal against the level earlier mentioned will most potentially push back the market into the bullish channels.
At the market of $30, there seems to a strong barrier that bears may still count upon for their sell entry especially, if the price loses momentum after briefly pushing past the point. Interception of the bigger SMA by the smaller SMA from the top appears not releasable in a near time to be able to forecast a return of downward once more. Even as there can still be room for an amount of lower higher below all the indicators, it could mean it is all to build up a lower buying wall in the long run. Therefore, sellers need to be cautious of their positions at that level.
UNI/BTC Price Analysis
In about couple of days’ trading operations, the UNI/USD price chart shows a price depression. But, in about four days’ sessions now, the base trading crypto has embarked on a significant increase as compared with the counter trading tool. A notable price line has been marked as the base support line for the current swing high from which UNI started. The 14-day SMA is located above the 50-day SMA indicator as the base crypto’s value has now recovered moving past them to the north. The Stochastic Oscillators are seemingly making an attempt to close the hairs a bit over range 40. That signifies that there may soon be a lees-active motion in the present upswing.In all in all, the base crypto is now pushing harder against the valuation of the counter crypto.
Note: new.cryptosignals.org is not a financial advisor. Do your research before investing your funds in any financial asset or presented product or event. We are not responsible for your investing results.