Tron (TRX) Bulls Are Unstoppable, They Are Now Targeting $0.07
Estimated Reading Time: 2 minutes
Don’t invest unless you’re prepared to lose all the money you invest. This is a high-risk investment and you are unlikely to be protected if something goes wrong. Take 2 minutes to learn more
The $0.065 price level has been posing a major hindrance to the Tron market since the middle of January. And the market has continued to reattempt the price level since then but has been unable to break this resistance. The resistance has remained unmoveable since the middle of January, but the bulls are not taking no for an answer. Since January 18, we have noticed the appearance of higher lows with no significant higher highs. The bears continue to maintain the key resistance level of $0.65 despite the increasing pressure.
TRX/USD Price Statistic
- TRX/USD price now: $0.069
- TRX/USD market cap: $6,277,904,959
- TRX/USD circulating supply:91,620,385,616 TRX
- TRX/USD total supply:91,620,464,214
- TRX/USD coin market cap rank: #15
Key Levels
- Resistance: $0.070, $0.075, $0.080
- Support: $0.060, $0.035, $0.030
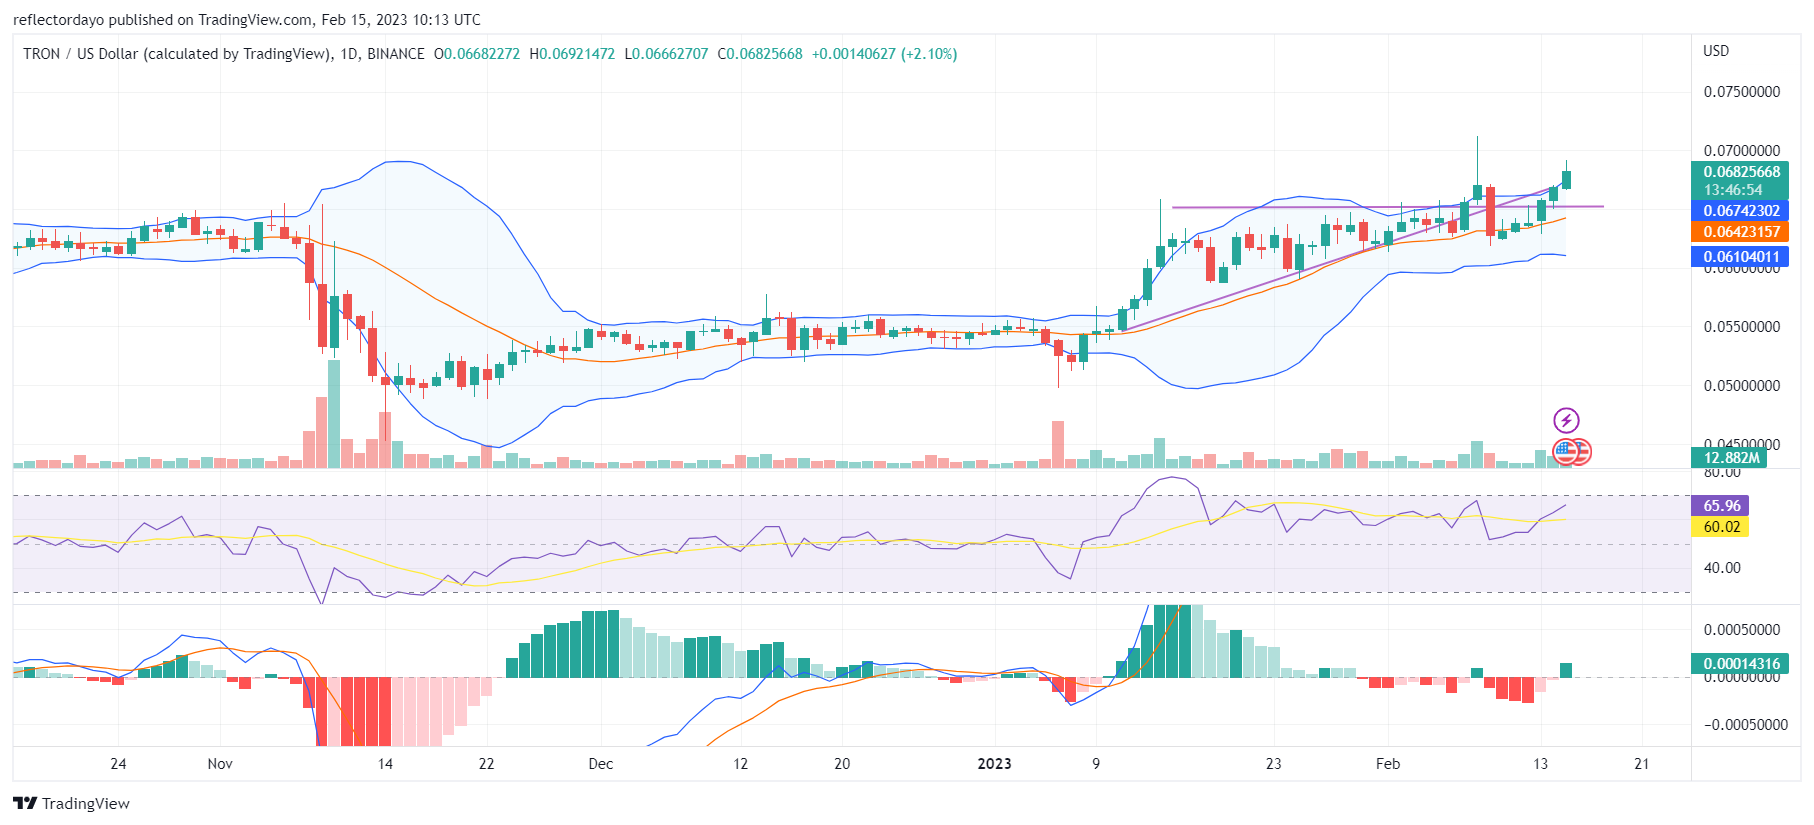
Price Prediction for Tron: The Indicators’ Point of View
The candlestick pattern forms an ascending wedge triangle, which indicates that the bullish trend will continue. After capturing the key major resistance level, the bulls set a new target at the $0.07 price level. As a result of this, the Bollinger bands indicator illustrates the price channel taking up an upward trend as the bulls appear to have more room for action in the market.
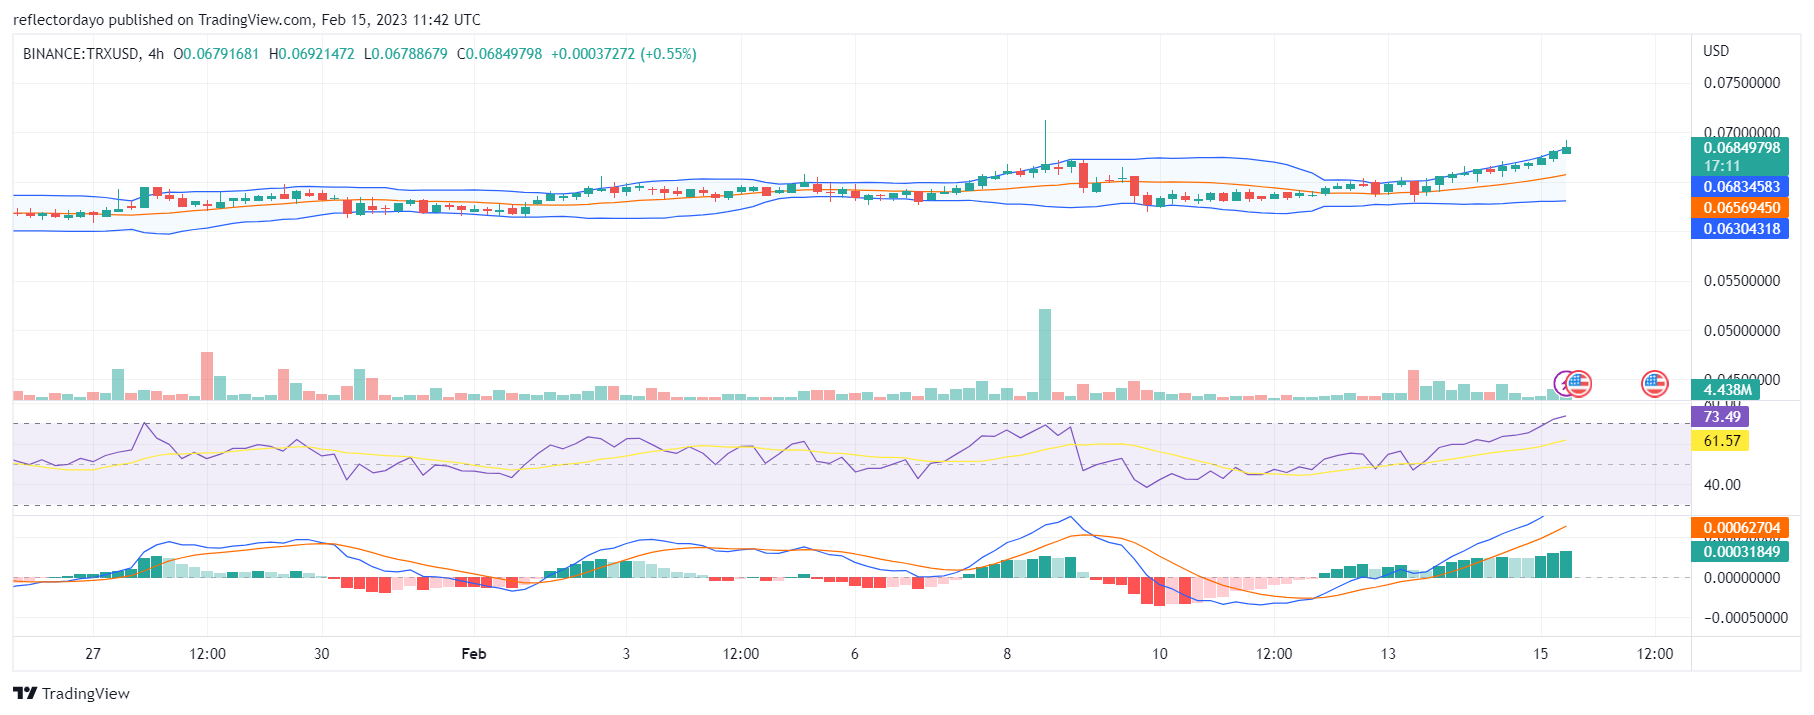
TRX/USD 4-Hour Chart Outlook
The market is breaking out in a bullish way. The upper standard deviation curve of the Bollinger indicator reflects the strong bullish activities in the market as it moves in agreement with the price action. The 20-day moving average is also beginning to move in the upward direction. There is still room for more bullish price action, as the indicators point to the activities of aggressive bulls.