UNUS SED LEO Price Prediction: LEO/USD Plunges Below $4.0 Resistance
Estimated Reading Time: 3 minutes
Don’t invest unless you’re prepared to lose all the money you invest. This is a high-risk investment and you are unlikely to be protected if something goes wrong. Take 2 minutes to learn more
UNUS SED LEO Price Prediction – July 30
Today, the UNUS SED LEO price prediction faces a pullback as the price slide below $4.0 to test the support level at $3.92 level.
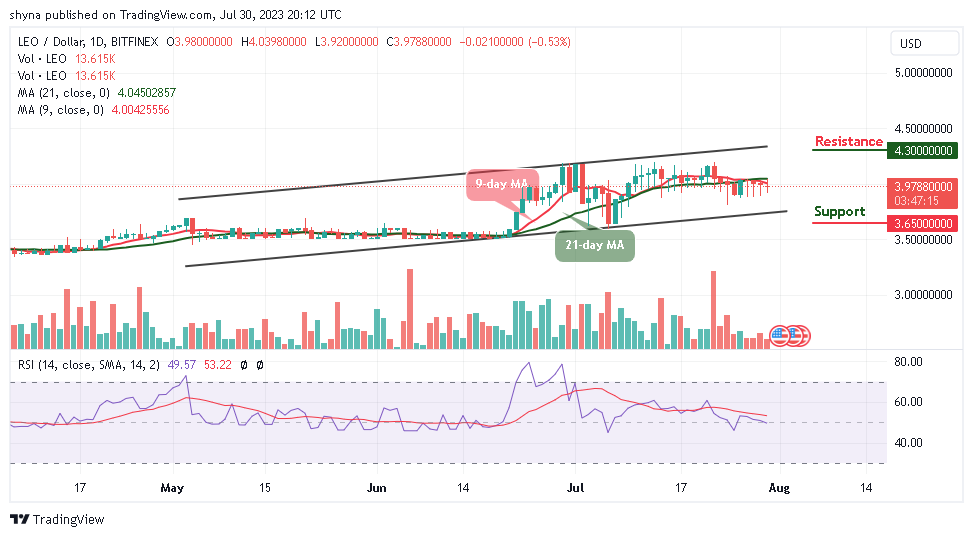
LEO/USD Long-term Trend: Ranging (Daily Chart)
Key levels:
Resistance Levels: $4.30, $4.50, $4.70
Support Levels: $3.65, $3.45, $3.25
LEO/USD has not been able to breach the $4.0 resistance level following a recent rejection at $4.03. On the downside, support has been established at $3.92. LEO/USD is trading at $3.97 at the time of writing. The prevailing trend is having a bearish bias, but the bullish interest has not left the market despite the resistance at $4.03.
UNUS SED LEO Price Prediction: What to Expect from UNUS SED LEO (LEO)
At the moment, the UNUS SED LEO price is deciding below the 9-day and 21-day moving averages, where the sellers are anticipating a clear breakdown toward the lower boundary of the channel. Moreover, if the red line of the 9-day MA remains below the green line of the 21-day MA, the market may continue to experience more downtrends. Nevertheless, should the bulls return to the market, this could take the price to the resistance levels of $4.30, $4.50, and $4.70.
However, if the market continues to follow the downward trend, the price of UNUS SED LEO is likely to drop to $3.70, and should this support fails to contain the sell-off, we could see a further roll back to $3.65, $3.45, and $3.25 support levels as the technical indicator Relative Strength Index (14) moves to cross below the 50-level, suggesting bearish movement.
LEO/USD Medium-term Trend: Ranging (4H Chart)
The 4-hour chart reveals that the UNUS SED LEO price is moving sideways at the time of writing this, trading below the 9-day and 21-day moving averages of around $3.97. Meanwhile, the coin is yet to slip below the $3.90 support but it is still in the loop of making a bounce back as it may take time to persistently trade above $4.0.
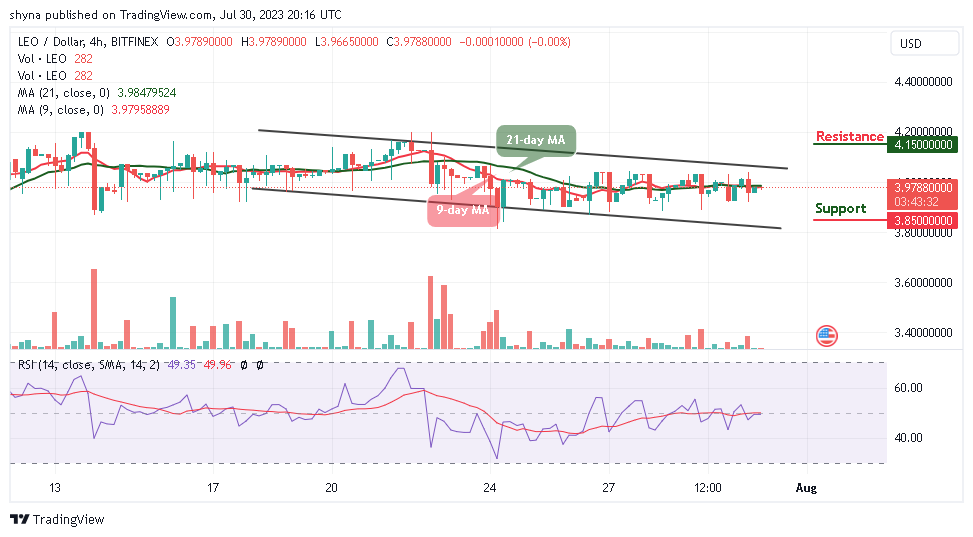
Moreover, LEO/USD is attempting to cross above the moving averages as the technical indicator Relative Strength Index (14) moves sideways. Therefore, this may likely drag the UNUS SED LEO price to the nearest support of $3.85 and below while the potential resistance lies at $4.15 and above.
Place winning LEO trades with us. Get LEO here