Bitcoin (BTC/USD) Market Holds a Rebounding Motion
Estimated Reading Time: 3 minutes
Don’t invest unless you’re prepared to lose all the money you invest. This is a high-risk investment and you are unlikely to be protected if something goes wrong. Take 2 minutes to learn more

Free Crypto Signals Channel
Bitcoin Price Prediction – February 23
It observed that the BTC/USD market operation holds a rebounding motion after gaining support a bit lower of $37,500. The crypto-economic price activities have seen $39,241 and $37,540 at a positive percentage of about 2.18.
BTC/USD Market
Key Levels:
Resistance levels: $40,000, $42,500, $45,000
Support levels: $37,500, $35,000, $32,500
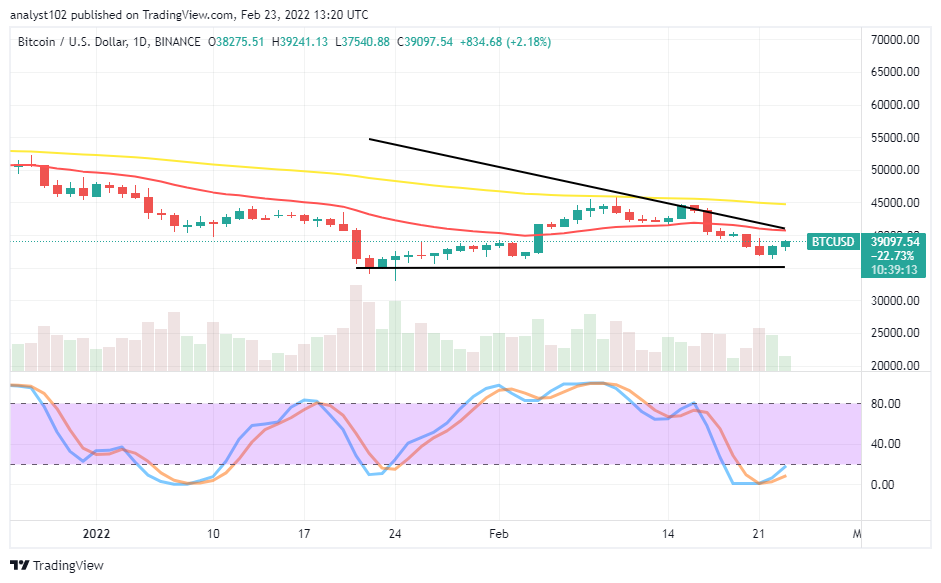
BTC/USD – Daily Chart
The BTC/USD daily chart has revealed that the crypto-economic market holds a rebounding motion given about two bullish candlesticks in the making. The 14-day SMA indicator is above the $40,000 underneath the 50-day SMA indicator, around the $45,000 resistance level. The Stochastic Oscillators are in the oversold region, crossing their lines northbound closer to the range of 20. That suggests an upward momentum is ongoing in the crypto business transactions.
Should traders expect a sudden aggressive breakout at $40,000 as the crypto-economic market holds a rebounding motion averaging the value-line?
There would be a need to exercise some precautionary steps as regards placing an order at this point as the BTC/USD market holds a rebounding motion toward the $40,000 level. Presently, the trading outlook backs that buying forces are prevailing over other trends. Nevertheless, long-position placers would have to be on the lookout for active price action going for an upside move to back up their entries.
On the downside of the technical analysis, it is still that the resistance trading zones are between $40,000 and $45,000 as the current bearish trading cycle of the crypto economy. Based on that assumption, it would technically augur well to wait for the exhaustion of the rebounding motion by taking to the market’s reading condition that will have to be portended by the Stochastic Oscillators afterward. A price rejection has to occur around those points again after some days to come.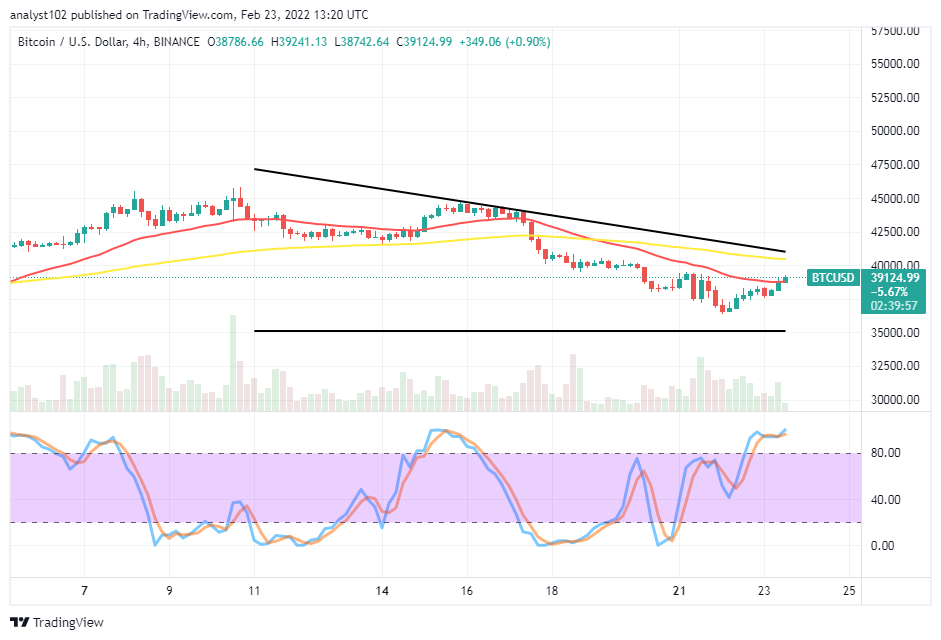
BTC/USD 4-hour Chart
The BTC/USD medium-term chart showcases the crypto-economic market holds in rebounding motion as the price is currently striving to break past the trend line of the smaller SMA to the upside. The 50-day SMA indicator is above the 14-day SMA indicator. Going by the descending triangular shape drawn, the opinion remains that the crypto economy may hit resistance around the upper bearish trend line drawn over the SMAs. The Stochastic Oscillators are in the overbought region, clogging their movements within. The presumed downward trend will resume after a full-fledged bearish candlestick emerges at a higher trading zone before considering a sell order afterward.
Note: Cryptosignals.org is not a financial advisor. Do your research before investing your funds in any financial asset or presented product or event. We are not responsible for your investing results.
You can purchase Lucky Block here. Buy LBlock: