Wall Street Memes (WSM) Market Bears Lose Grip, Bulls Push On
Estimated Reading Time: 3 minutes
Don’t invest unless you’re prepared to lose all the money you invest. This is a high-risk investment and you are unlikely to be protected if something goes wrong. Take 2 minutes to learn more

Wall Street Memes Price Prediction – September 10
As of the time of this piece, it is closely seen that a series of recouping moves has played out below the $0.0005 line, as the WSM/USD market bears lose grip while bulls keep pushing.
From a long-term technical standpoint, maintaining positions remains justifiable as the WSM/USD market bears steadily lose control while bulls extend upward pressure. The persistence of sustained momentum, bolstered by established structural supports and firming oscillator readings, indicates that strategic buyers could capitalize on progressive recovery phases advancing toward elevated valuation territories.
WSM/USD Market
Key Levels
Resistance levels: $0.0006, $0.0007, $0.0008
Support levels: $0.0004, $0.0003, $0.0002
WSM/USD – 4-hour Chart
The WSM/USD medium-term chart indicates that crypto-economic market bears are gradually losing grip, while bulls continue to exert upward pressure in a sustained and structured manner.
The Stochastic Oscillators have turned southbound, pointing closely to the line of 20, signaling that the market’s baseline is once again set to ripen soon. The Bollinger Bands are still converging within the $0.0005–$0.0004 range, underscoring the market’s ongoing consolidation zone.
Will WSM/USD Market Bears Keep Losing Grip as Bulls Exert Sustained and Structured Upward Pressure?
Over the long term, the WSM/USD market outlook remains decisively tilted in favor of bullish strength, as crypto-economic trade bears continue to lose grip while sustained upward pressure builds.
Reinforced by structural supports, tightening Bollinger Bands, and oscillator stability near oversold zones, the probability of progressive rallies promises a firmer trajectory. Sellers’ efforts appear increasingly negated, with momentum signaling a potential for consolidation breakouts and higher valuation zones, encouraging buyers to maintain positions for continued advantage.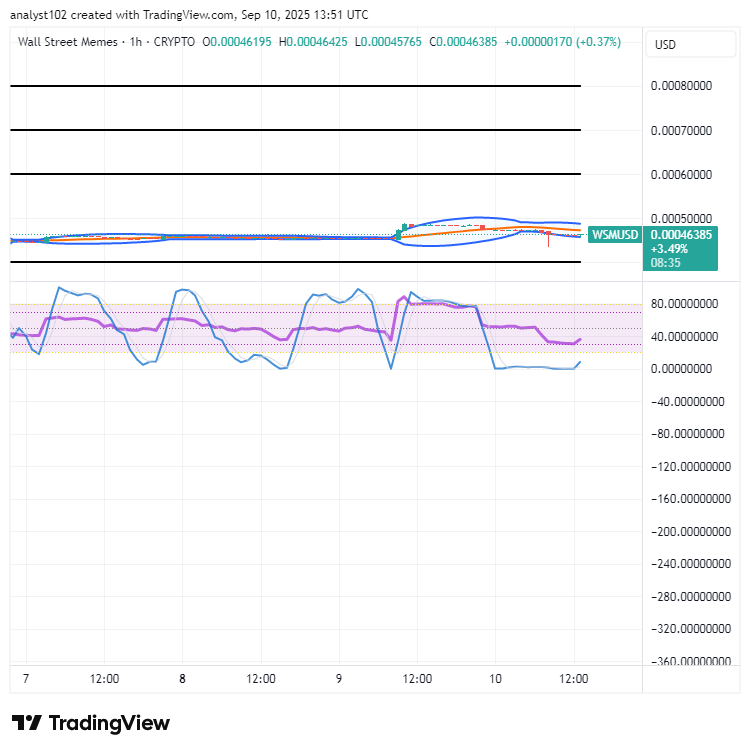
WSM/USD 1-hour chart
The 1-hour chart of the WSM/USD market showcases that the crypto-economic bears are steadily losing ground, paving the way for bulls to push on.
The Stochastic Oscillators have dipped into the oversold region, suggesting that buyers are actively seeking favorable recouping opportunities. Meanwhile, the Bollinger Bands have systematically realigned, illustrating strengthening bullish control and establishing a formidable threshold for buyers to capitalize on.
Stake Now ➡️(https://wallstmemes.com/en/dashboard) and start earning rewards today!
Buy Now ➡️ (https://wallstmemes.com) to secure your profitable crypto opportunity.
🔥 Up To 43% APY Now Available 🔥
— Wall Street Memes (@wallstmemes) October 8, 2023
(at the time of posting)
Stake Now ➡️ https://t.co/X031FQo0bW Buy Now ➡️ https://t.co/6zkwWf1VRF pic.twitter.com/o9qrY1zJn8