Wall Street Memes (WSM) Market Is Resilient, Attracting Bounces
Estimated Reading Time: 3 minutes
Don’t invest unless you’re prepared to lose all the money you invest. This is a high-risk investment and you are unlikely to be protected if something goes wrong. Take 2 minutes to learn more

Wall Street Memes Price Prediction – August 9
Currently, as it is depicted by oscillating tools, it appears that the Wall Street Memes coin market pushers will have to be taking more time as they are trading against the market values of the American currency, given that the crypto economy is resilient in its stances, attracting bounces in the outer faces.
Long-term investors may anticipate prolonged consolidation in Wall Street Memes, as resilience in the broader crypto market supports intermittent rebounds despite persistent pressure from the American currency’s relative strength.
WSM/USD Market
Key Levels
Resistance levels: $0.0008, $0.0009, $0.001
Support levels: $0.0005, $0.0004, $0.0003
WSM/USD – 4-hour Chart
The medium-term chart of the WSM/USD shows that the crypto economy is resilient in the moving style, attracting bounces.
The Bollinger Bands indicators have converged closely and tightly around $0.00057136, signifying reduced volatility and indicating that buyers are yet to exert decisive upward pressures. The stochastic oscillators remain positioned in the overbought region, reaffirming that purchasers are still struggling to decisively break through established overhead resistance barriers, despite marginal bullish momentum attempts.
Is Exercising Patience with Staking-Based Entry Strategies Still a Technically Prudent Approach for WSM/USD Trade Partakers?
For long-term capitalists in the business activities of the WSM/USD market, maintaining staking-based entry strategies remains technically sound, as the broader market structure suggests resilient undercurrents capable of fostering sustained value appreciation over extended holding horizons.
Slightly lingering downside pressure has shifted the pairing instrument into a technically advantageous pullback zone, maintaining a buoyant environment for purchasers to secure positions.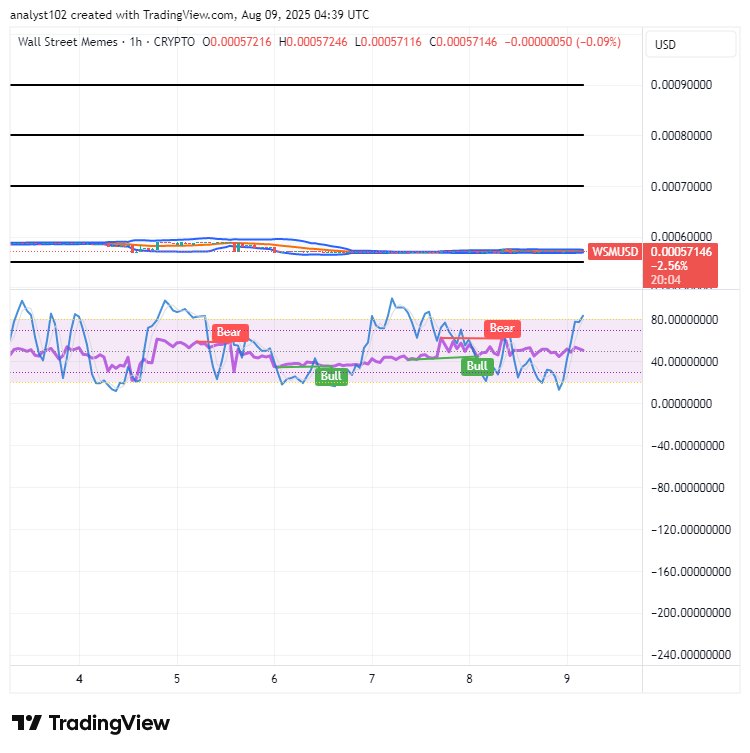
WSM/USD 1-hour chart
The 1-hour chart of the WSM/USD trade is resilient in its moving pattern, attracting bounces in the setup.
The trend lines of the Bollinger Bands are closely stretched eastward, highlighting the sustained validity of the prevailing sideways price momentum and reduced volatility. Meanwhile, the stochastic oscillators have traversed northbound, briefly crossing above the 80 mark into the overbought region, reinforcing signals of short-term bullish pressure buildup.
$WSM community, we saw your Tweets! 👏$WSM / $USDT is now tradeable on #Bybit Perpetuals.
— Bybit (@Bybit_Official) October 13, 2023
Trade here: https://t.co/le4XyVyXaZ
Also want your project listed? Share your suggestions here:https://t.co/W7EWJVVNV5 https://t.co/XgXoL7g0rF