Wall Street Memes (WSM) Market Slightly Rises, Staying Steady
Estimated Reading Time: 3 minutes
Don’t invest unless you’re prepared to lose all the money you invest. This is a high-risk investment and you are unlikely to be protected if something goes wrong. Take 2 minutes to learn more

Wall Street Memes Price Prediction – October 8
Observation notes currently indicate that the market operation of the Wall Street Memes coin, measured against the valuation of the American fiat currency, shows the base instrument slightly rising and maintaining stability.
The Wall Street Memes’ market performance against the U.S. dollar reflects a modest upward movement, with the asset maintaining stability in its overall trading behavior. Broader market sentiment continues to favor a long-term holding approach, as investors anticipate sustained growth potential and consistent consolidation patterns that could strengthen the coin’s value base over time.
WSM/USD Market
Key Levels
Resistance levels: $0.0008, $0.0009, $0.001
Support levels: $0.0005, $0.0004, $0.0003
WSM/USD – 4-hour Chart
The WSM/USD medium-term chart currently indicates a slight market rise with steady performances amid growing investor optimism.
.
The Bollinger Bands maintain a consistent upward tilt, underscoring a firmly sustained bullish outlook. Meanwhile, the Stochastic Oscillators have moved northward into the overbought region, remaining under a less-active bearish influence, suggesting that bullish participants are still in an active phase of consolidation and controlled struggle to maintain upward momentum.
Could Sustained Long-Term Holding Strengthen Wall Street Memes’ Value Base Over Time?
Sustained long-term holding could reinforce Wall Street Memes’ value base, as consistent investor confidence and reduced short-term volatility may foster a more stable market structure, paving the way for gradual appreciation and stronger technical resilience over time.
However, traders should remain cautious, as the market could shift into a sideways consolidation phase unexpectedly. During such periods, price fluctuations may become compressed, requiring careful monitoring of momentum indicators and volume trends to avoid premature entries or unnecessary liquidation of profitable positions.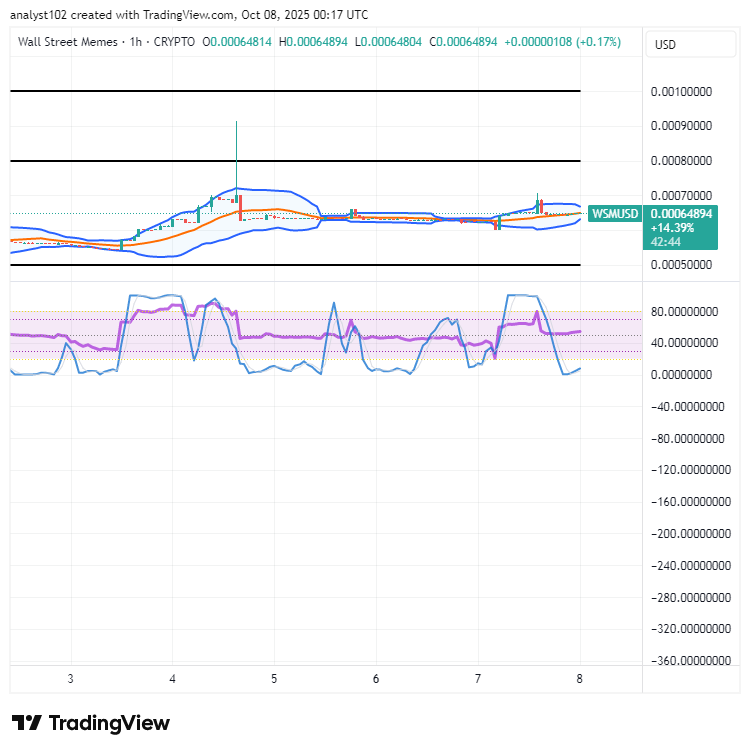
WSM/USD 1-hour chart
The 1-hour chart of WSM/USD shows that the crypto-economic market slightly rises, staying steady.
The Bollinger Bands have been systematically positioned to highlight zones where favorable long entries can be identified, reinforcing the likelihood of a sustained upward continuation in subsequent trading sessions. Meanwhile, the Stochastic Oscillators have turned southbound, dipping deeper into the oversold region, suggesting that a potential recovery phase may soon emerge as buying pressure gradually rebuilds.
COUNTDOWN BEGINS — JUST DAYS AWAY FROM AN EPIC $1M BUYBACK COMPLETION!
$WSM
Secure Your Spot Now ➡️ [http://bit.ly/Twitter_WSM_BUY](http://bit.ly/Twitter_WSM_BUY)
3 DAYS TO GO UNTIL A MASSIVE $1M OF BUYBACKS IS COMPLETED! 🔥 $WSM 🚀
— Wall Street Memes (@wallstmemes) October 8, 2023
Buy Now ➡️ https://t.co/ffr2clEknx pic.twitter.com/bs8uNKIp8D
Buy and stake WSM now! https://wallstmemes.com/