Wall Street Memes (WSM) Market Spikes, Rectifying a Base
Estimated Reading Time: 3 minutes
Don’t invest unless you’re prepared to lose all the money you invest. This is a high-risk investment and you are unlikely to be protected if something goes wrong. Take 2 minutes to learn more
Wall Street Memes Price Prediction – August 1
In the last couple of hours, it was observed that Wall Street Memes pushed strongly as it has been trading against the valuation of the American currency, given that the crypto business market spiked abruptly, rectifying a base in returns.
The recording of a significant upsurge in the activities of the WSM trade showcases that formidable, stable, and seemingly irreversible up-strides are continually recoiling upward in the way of intensified preparation to break variant overhead barriers in the long-term running mode.
WSM/USD Market
Key Levels
Resistance levels: $0.0008, $0.0009, $0.001
Support levels: $0.0005, $0.0004, $0.0003
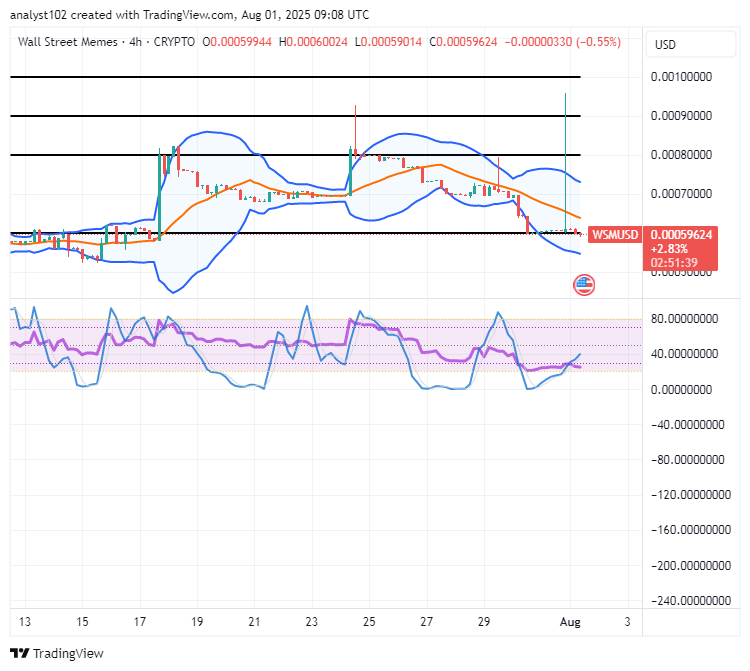
WSM/USD – 4-hour Chart
The medium-term chart of the WSM/USD market shows the price spikes suddenly before resuming to a process of rectifying a base.
The Bollinger Bands indicators are currently aligned in a bullish pennant formation, reinforcing $0.0006 as the critical pivotal trade zone in the ongoing effort to establish a structural base. Concurrently, the stochastic oscillators continue to reshape their trajectory within the oversold region, fluctuating through several levels beneath the 40-line threshold.
Given WSM/USD’s pullback to $0.0006, should investors consider initiating strategic sell-off positions?
Rather than initiating strategic sell-offs, investors may consider holding positions or gradually accumulating, anticipating a recovery phase from this critical pivot zone, as the WSM/USD market spiked up suddenly recently before turning into rectifying a base mode.
Despite the pullback to $0.0006, the current technical structure suggests that WSM/USD may be forming a solid accumulation base. The retracement to the trade spot appears to reflect healthy market digestion, potentially laying the groundwork for a renewed bullish momentum in WSM/USD.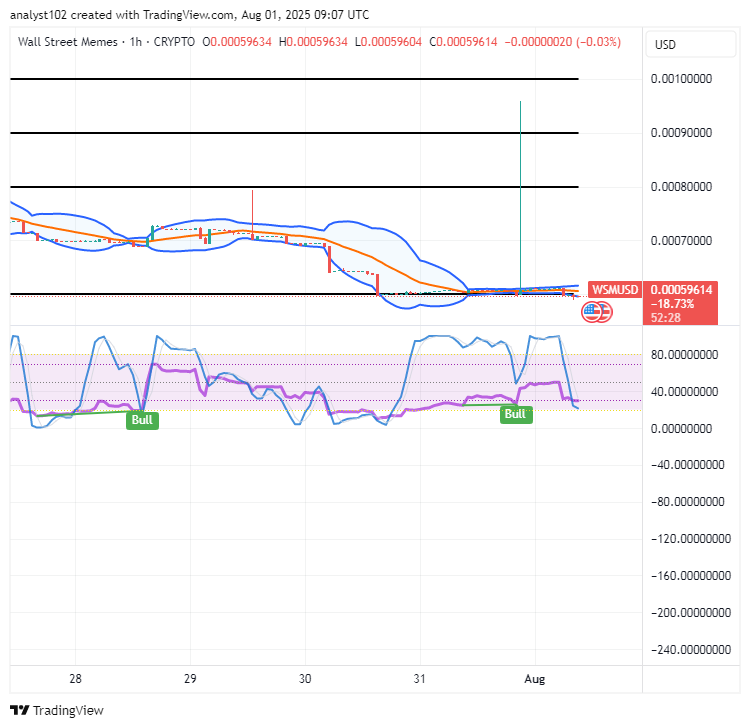
WSM/USD 1-hour chart
The 1-hour chart of the WSM/USD trade has depicted that the short-term crypto-economic market spikes vigorously through resistances above the line of $0.0009 before rectifying a base.
The stochastic oscillators are now found systemically tilting downward to solidify a recouping myth in the base instrument ahead of another round of potential technical bounce-offs. Meanwhile, the Bollinger Bands have stylishly stayed compressed to create short flap-shaped zones, affirming a gradually intensifying basement formation with stabilizing tendencies.
BIGTIMEUSDT & WSMUSDT Contracts are now officially live and tradeable on Bybit!
🚀 BIGTIMEUSDT & WSMUSDT Contracts now on Bybit!
— Bybit (@Bybit_Official) October 12, 2023
Dive into new trading opportunities with 1-25x leverage. Plus, they’re now on Bybit Futures Grid Bot! Start trading now.
📈 BIGTIME: https://t.co/FAQlbhnzAh
📈 WSM: https://t.co/pb2y2AfMBE#CryptoTrading #Bybit