Wall Street Memes (WSM) Price Bounces, Sellers Lose Basis
Estimated Reading Time: 3 minutes
Don’t invest unless you’re prepared to lose all the money you invest. This is a high-risk investment and you are unlikely to be protected if something goes wrong. Take 2 minutes to learn more

Wall Street Memes Price Prediction – September 17
The Wall Street Memes coin demonstrates a resilient price rebound against the U.S. dollar, indicating intensified accumulation as sellers increasingly lose technical footing.
The recent rebound in the Wall Street Memes coin against the U.S. dollar underscores a pronounced shift in underlying momentum, where valuation dynamics and structural forces strategically converge to favor re-calibration on the upside. Strengthening liquidity inflows, tightening seller pressure, and improved risk appetite collectively reinforce sustained market strength. These evolving conditions suggest that the WSM/USD pairing could maintain extended bullish traction over the medium to long term, establishing firmer ground for potential breakout sequences.
WSM/USD Market
Key Levels
Resistance levels: $0.0006, $0.0007, $0.0008
Support levels: $0.0004, $0.0003, $0.0002
WSM/USD – 4-hour Chart
The WSM/USD medium-term chart illustrates notable crypto-economic price bounces, as sustained buying activity erodes sellers’ structural basis.
The Bollinger Band trend lines are shaping a constructive flagship pattern, clustering near favorable long entry zones with strengthening momentum, reinforcing the likelihood of potential breakout opportunities ahead. The Stochastic Oscillators are positioned at lower spots, trying to point back to the upside direction.
Will the WSM/USD Upward Bounce Establish Firmer Support as Persistent Sellers Keep Losing Basis?
The WSM/USD rebound indicates momentum re-calibration, with diminishing seller dominance creating conditions for renewed accumulation, stronger demand zones, and the potential continuation of bullish price trajectories ahead.
Supporting indicators, including tightening Bollinger Bands and Oscillators recovering from oversold zones, reinforce the prospect of sustained bullish pressure, suggesting the market may consolidate at higher levels before attempting broader breakout extensions in upcoming sessions.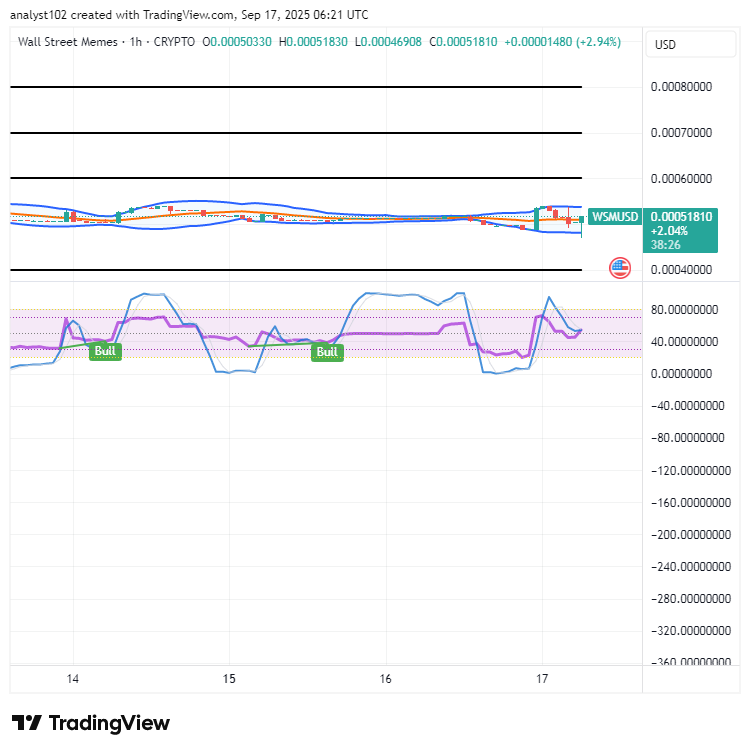
WSM/USD 1-hour chart
The 1-hour chart of the WSM/USD market reveals pronounced crypto-economic price bounces, indicating that sellers are gradually losing structural basis as buying momentum strengthens.
The Bollinger Bands have stretched sideways with a decisive upward tilt, confirming that buyers are aggressively positioning for imminent gains. Meanwhile, the Stochastic Oscillators maintain steady postures, reinforcing sustained bullish momentum and signaling further potential price elevation.
Over the last 24 hours, the $WSM token and community has faced a coordinated, malicious cyber attack, as hackers specifically and deliberately targeted our official Discord community platform, aiming to disrupt trust, stability, and ongoing investor confidence.
Over the last 24 hours, The $WSM token and community has undergone a coordinated attack. The hackers specifically targeted our Discord community.
— Wall Street Memes (@wallstmemes) October 12, 2023
We reiterate that no one from the Wall St Memes team will ever direct message you first, or ask for any personal information – even… pic.twitter.com/VwySpXC7cz