Wall Street Memes (WSM) Price Hits $0.001, Holding Hikes
Estimated Reading Time: 3 minutes
Don’t invest unless you’re prepared to lose all the money you invest. This is a high-risk investment and you are unlikely to be protected if something goes wrong. Take 2 minutes to learn more

Wall Street Memes Price Prediction – February 2
Following formidable regaining processes that led to the WSM/USD market gaining back an upswing from the zones of $0.0005, being set as the underlying support over time, the base business economy now tends to maintain reliable moves to the moon, given that the price hits $0.001, holding hikes.
Currently, a technical reversal pattern is emerging, characterized by a series of short-term retracements. This reversal is likely attempting to establish a viable entry point for long positions, converging around the middle Bollinger Band indicator’s positioning.
WSM/USD Market
Key Levels
Resistance levels: $0.0012, $0.0017, $0.0022
Support levels: $0.0005, $0.0004, $0.0003
WSM/USD – 4-hour Chart
The WSM/USD market 4-hour chart showcases that the crypto-economic trade hits $0.001, holding hikes in inputs.
The stochastic oscillators are exhibiting a bearish divergence, repositioning in a downward trajectory, approaching the oversold threshold of 20. This suggests that the corrective moves are unfolding with caution. Meanwhile, the Bollinger Bands have expanded, indicating a rise in volatility. The upper band ($0.001) and lower band ($0.0005) are delineating the initial resistance and support levels, respectively, thereby setting the stage for potential price fluctuations within this defined range.
As the WSM/USD market is shifting downward toward the middle Bollinger Band, should sellers intensify more efforts?
Resurfacing of down-trending pressures in the operations of Wall Street Memes coin versus the market’s stance on the US fiat money from the technical point of view at this point is to let there be a delay in an open window of opportunities to allow buyers to join the investment cycle, as the price hits $0.001, holding hikes mostly in the method of generating promissory rising signals.
That scenario may also induce uncertainty regarding the optimal trading horizon, with traders potentially oscillating between short-term and medium-term strategies. However, a long-term investment approach is recommended as the most viable option, allowing traders to ride out market fluctuations and capitalize on sustained trends.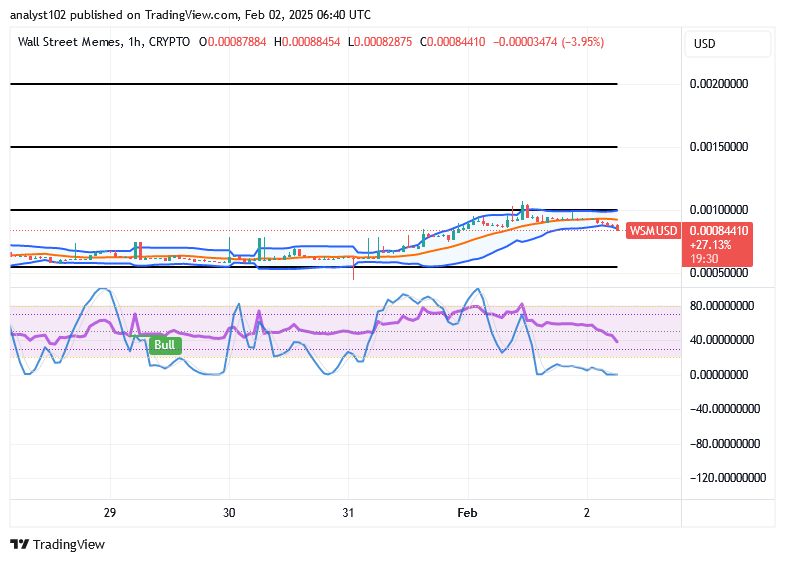
WSM/USD 1-hour chart
The 1-hour chart reveals that the WSM/USD market operation hits $0.001, holding hikes in inputs.
The Bollinger Bands’ positioning arrangement has exhibited a bullish trajectory, shifting northward and indicating an accelerating rate of accumulation in favor of the base currency relative to its counterpart. Furthermore, the stochastic oscillators’ placement within the oversold region suggests that a buying momentum reversal is imminent, as the oscillators are poised to rebound, potentially catalyzing renewed purchasing pressure.
When did the phenomenon of working two jobs become a societal norm?
When did it become normal to work 2 jobs? pic.twitter.com/RhvVsrxhtz
— Wall Street Memes (@wallstmemes) February 1, 2025
Buy and stake WSM now!: Wall Street Meme (WSM)