Wall Street Memes (WSM) Price Is in Ranges, Gripping Muscles
Estimated Reading Time: 3 minutes
Don’t invest unless you’re prepared to lose all the money you invest. This is a high-risk investment and you are unlikely to be protected if something goes wrong. Take 2 minutes to learn more
Wall Street Memes Price Prediction – April 9
The systemic structure of the bargaining mode continues to strengthen as the Wall Street Memes crypto economy aligns with the marketing power of the American fiat money, while the crypto market is in ranges, gripping muscles.
A distinct market move has consistently showcased that long-term position takers are still being strategically allowed to remain firmly in the pathway of tending to regain stronger stances, which do not permit any decency in the mere shifting pattern toward the downside.
WSM/USD Market
Key Levels
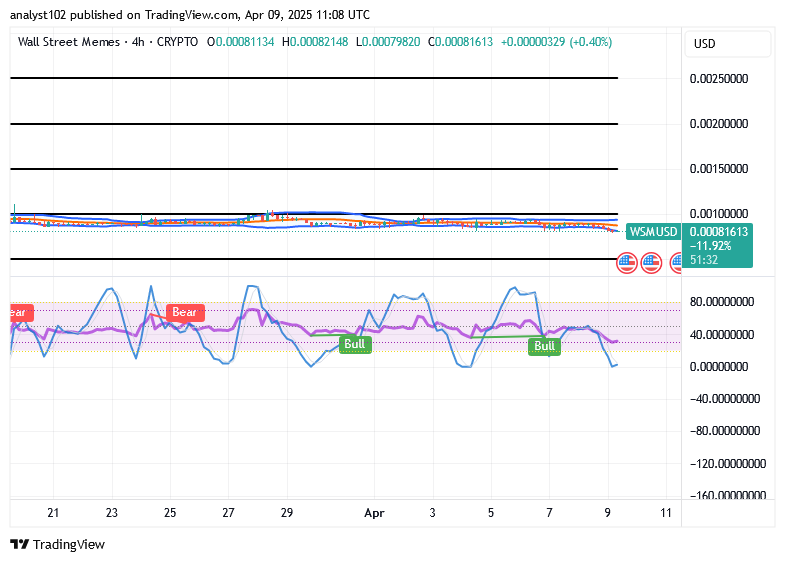
Resistance levels: $0.0015, $0.002, $0.0025
Support levels: $0.0008, $0.0006, $0.0004
WSM/USD – 4-hour Chart
The WSM/USD medium-term chart depicts that the crypto-economic trade is in ranges, gripping muscles in its signification.
It is relatively signaled that variant candlesticks that have been recently featured on the threshold of the lower Bollinger Bands indicators are highly liable to attempt to recoup their bottoms by making a slight losing force in the ongoing process. Furthermore, the stochastic oscillators have sharply stepped southbound deeper into the oversold region, explicitly indicating that buyers are likely going to regain substantial momentum to boost up back astride the trend.
As it appears that there have been some levels of declines in the WSM/USD market, would that be enough for investors to stop accumulation proceedings now?
As the pricing movements in the business activities that paired Wall Street Memes coin with the US currency continue to witness more slight lows, it is not ideally logical to stop buying the falls, given that the trade is in ranges, gripping muscles.
From a broader technical perspective, the trade line is expected to consolidate around the $0.001 value level, forming a stable accumulation zone. This phase could present an opportunity for strategic long-term positioning, as traders anticipating a trend reversal may gradually build confidence. Once the former instrument gains traction, a potential breakout could follow, signaling a renewed bullish momentum and a recovery of its previous market standing.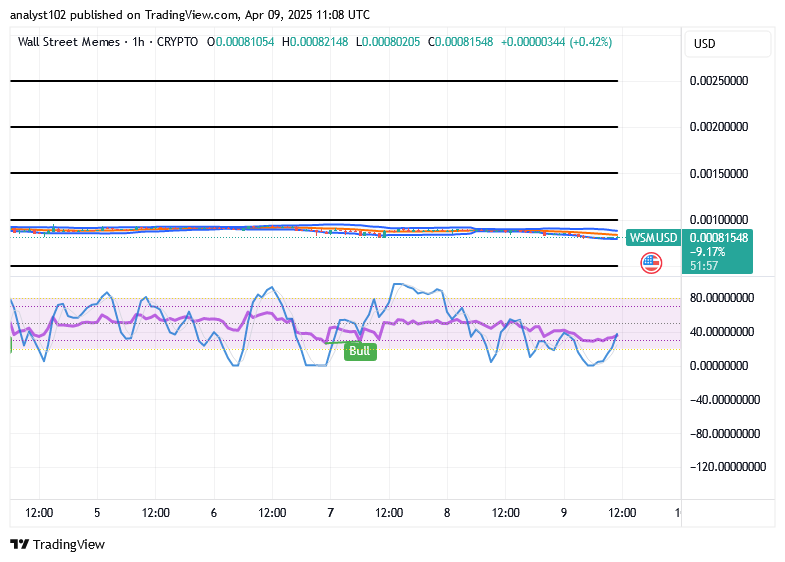
WSM/USD 1-hour chart
The WSM/USD 1-hour chart shows that the short-term movement of the base crypto is in ranges, gripping muscles.
There have been clear signs that the stochastic oscillators are being carefully laid gently and slantingly into the oversold region on a bullish signal setting. Meanwhile, the trending lines of the Bollinger Bands indicators are still being stretched further toward the east direction, distinctly denoting that the buying forces are actively in the process of gaining stronger stances.
In the past 24 hours, the $WSM token and its community have been subjected to a deliberate attack. The perpetrators specifically focused on breaching our Discord community.
Over the last 24 hours, The $WSM token and community has undergone a coordinated attack. The hackers specifically targeted our Discord community.
— Wall Street Memes (@wallstmemes) October 12, 2023
We reiterate that no one from the Wall St Memes team will ever direct message you first, or ask for any personal information – even… pic.twitter.com/VwySpXC7cz