Wall Street Memes (WSM) Trade Shows On, Garnering Spikes
Estimated Reading Time: 3 minutes
Don’t invest unless you’re prepared to lose all the money you invest. This is a high-risk investment and you are unlikely to be protected if something goes wrong. Take 2 minutes to learn more

Wall Street Memes Price Prediction – April 8
Reproduction proceedings systemic structure have remained being established in the mode that the Wall Street Memes crypto economy has been paired with the marketing power of the American currency, as the base instrument shows on a baseline, garnering spikes.
The ongoing market conditions suggest that long-term fund investors must remain committed to their disciplined trading strategies, strategically accumulating positions during price dips to capitalize on expected sharp recoveries.
WSM/USD Market
Key Levels
Resistance levels: $0.0015, $0.002, $0.0025
Support levels: $0.0008, $0.0006, $0.0004
WSM/USD – 4-hour Chart
The WSM/USD medium-term chart reveals that the crypto-economic trade, as of this write-up, shows positively on a baseline, garnering spikes.
Amid minor market fluctuations causing slight volatility, the Bollinger Bands have exhibited a marginal expansion, maintaining directional momentum toward the east. Meanwhile, the stochastic oscillators have continued oscillating within bullish territory, sustaining an upward bias over multiple trading sessions leading up to the present.
Should the WSM/USD traders expect to see more steady pushes to the downside against the lower Bollinger Band in the neafutureme?
It might take a longer time, as it is necessary to witness the WSM/USD market slipping stably along the pathway of the lower Bollinger Band indicator in a negative direction, as the trade shows a formidable baseline, garnering spikes in the indexes.
From the perspective of all indications, it is still believed that the trade line might undergo further sideways trading patterns around the value line of $0.001 for a while. That could cause some traders to hesitate in taking decisive steps because they might tend not to adopt the approach of holding on to a long-term running style before the base cryptocurrency begins regaining its lost position afterward.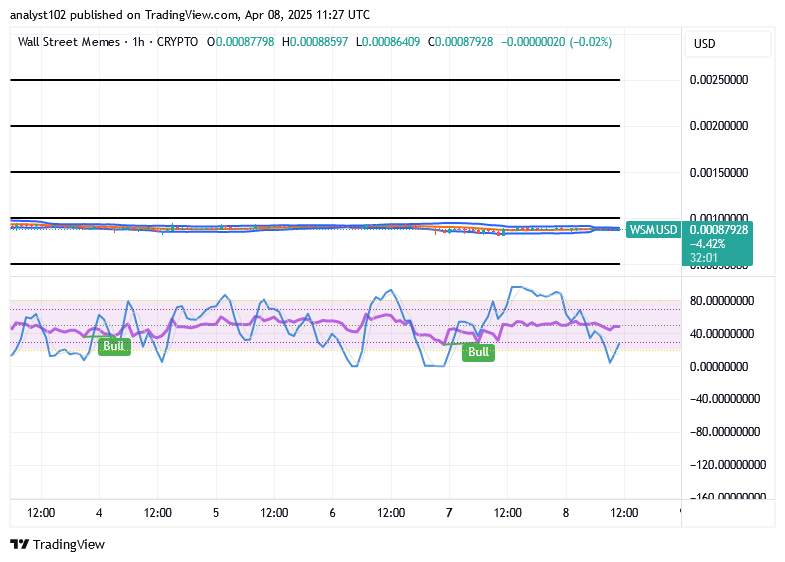
WSM/USD 1-hour chart
The WSM/USD 1-hour chart showcases that the short-term journey of the base crypto shows a basement, garnering spikes in inputs.
The trending systemic composure of the Bollinger Bands indicators has been seen steadily stretching to the east in a distinctive style of creating decencies toward confidently getting long orders. The way the stochastic oscillators have gradually stepped southbound into the oversold region clearly denotes that solid buying windows are yet being firmly established.
Execute Your Purchase Now ➡️ http://bit.ly/Twitter_WSM_BUY Securely.
4 DAYS TO GO UNTIL A MASSIVE $1M OF BUYBACKS IS COMPLETED! 🔥
— Wall Street Memes (@wallstmemes) October 7, 2023
🚀 $WSM 🚀
Buy Now ➡️ https://t.co/ffr2clEknx pic.twitter.com/pOrhialttd