Wall Street Memes (WSM) Price Is in Ranges, Picturing Spirals
Estimated Reading Time: 3 minutes
Don’t invest unless you’re prepared to lose all the money you invest. This is a high-risk investment and you are unlikely to be protected if something goes wrong. Take 2 minutes to learn more
Wall Street Memes Price Prediction – February 27
Inactiveness has continually persisted in the market lines that bond bulls with bears, causing the business transaction of the WSM/USD market to feature in ranges style, picturing spirals.
As the indicators suggest, a series of price actions conducive to further consolidation and sideways movement, driven by market indecision, is likely to persist for several sessions. This phase may lead to a gradual buildup of momentum, with the potential for stable rebounds, as the cryptocurrency market forms a solid base at a key support threshold.
WSM/USD Market
Key Levels
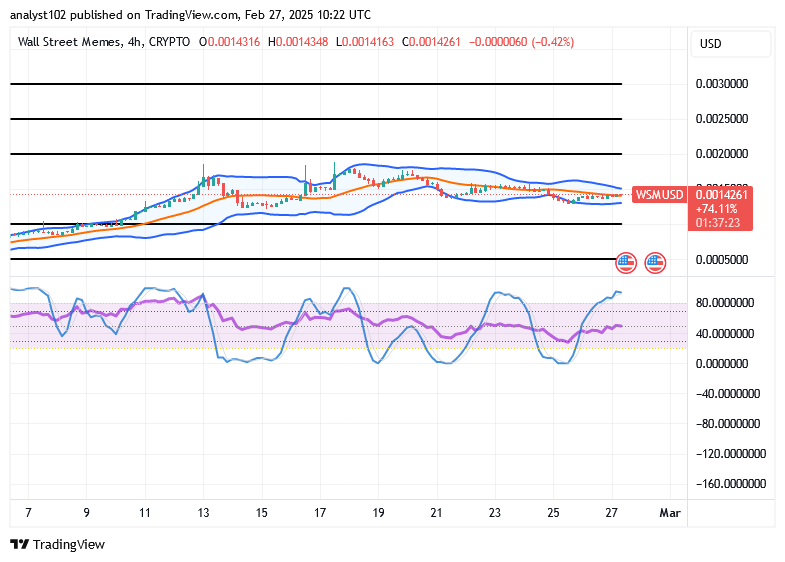
Resistance levels: $0.002, $0.0025, $0.003
Support levels: $0.001, $0.0008, $0.0006
WSM/USD – 4-hour Chart
The medium-term chart (4-hour chart) of the WSM/USD trade is now in a range setup, picturing spirals in inputs.
The candlestick formation currently indicates that price action is hovering around the middle Bollinger Band, confirming a sideways market structure. Simultaneously, the stochastic oscillators have quickly moved into the overbought region, signaling that upward momentum is still building and may continue to drive prices higher.
Is it reasonable for bulls in the WSM/USD market to continue maintaining prices in the middle and lower Bollinger Bands?
It has been yet another day of expecting the WSM/USD market long-term position executors to keep their presences on the thresholds being built around the middle and the lower Bollinger Bands indicators, as the outlook portends that the crypto economy is in ranges at the lower zones, picturing spirals in inputs.
In the interim, it might be psychologically a good idea to wait for some time, seeing the oscillating tools getting repositioned at a given reduction spot to see them pointing back to the upside afterward before staging decent long position orders in the proceedings.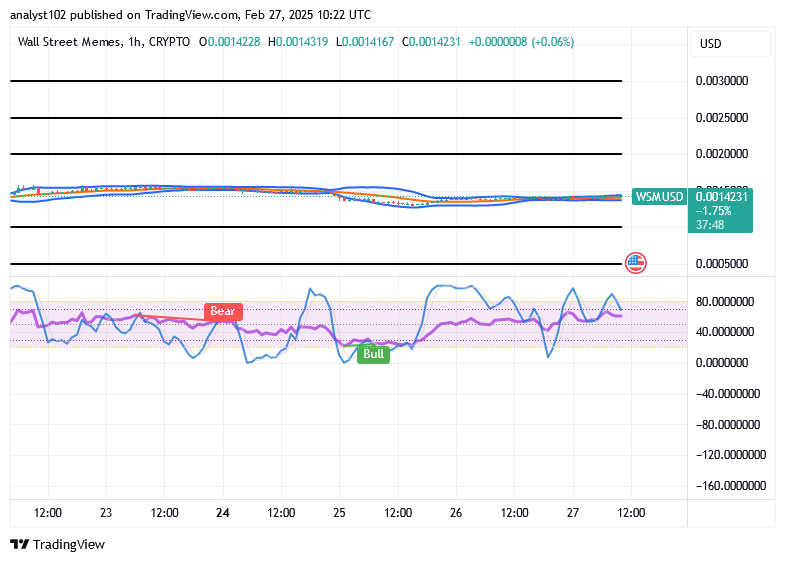
WSM/USD 1-hour chart
The 1-hour chart from the technical picture of the short-term setup depicts that the WSM/USD market is in ranges, picturing spirals.
The bullish signal from the stochastic oscillators suggests that buying momentum is nearing exhaustion in the hourly setup. The Bollinger Bands are converging near the $0.0015 value, indicating potential consolidation. This sets up an opportunity to secure the base asset at lower levels ahead of anticipated aggressive rallies expected over the coming months.
Retirement planning > insider trading
Insider trading > retirement plans https://t.co/bh21EKD5Ws pic.twitter.com/6ohyzISr8p
— Wall Street Memes (@wallstmemes) February 27, 2025
Buy and stake WSM now!: Wall Street Meme (WSM)