Wall Street Memes (WSM) Price Makes Moves, Denoting Hikes
Estimated Reading Time: 3 minutes
Don’t invest unless you’re prepared to lose all the money you invest. This is a high-risk investment and you are unlikely to be protected if something goes wrong. Take 2 minutes to learn more
Wall Street Memes Price Prediction – February 6
There have been steady efforts in the mode of seeing bulls waxing higher, as the economic trade situation now portends that the WSM/USD price makes moves, denoting hikes in inputs.
The price movements are now being systemically featured in smaller lengthy amounts within the northward pathway in the Bollinger Bands. Being as a signal note is exhibited by the candlestick formation pattern, buyers might see a pause coupled with smaller reversals before pushing through higher overhead barriers.
WSM/USD Market
Key Levels
Resistance levels: $0.001, $0.0015, $0.002
Support levels: $0.0005, $0.0004, $0.0003
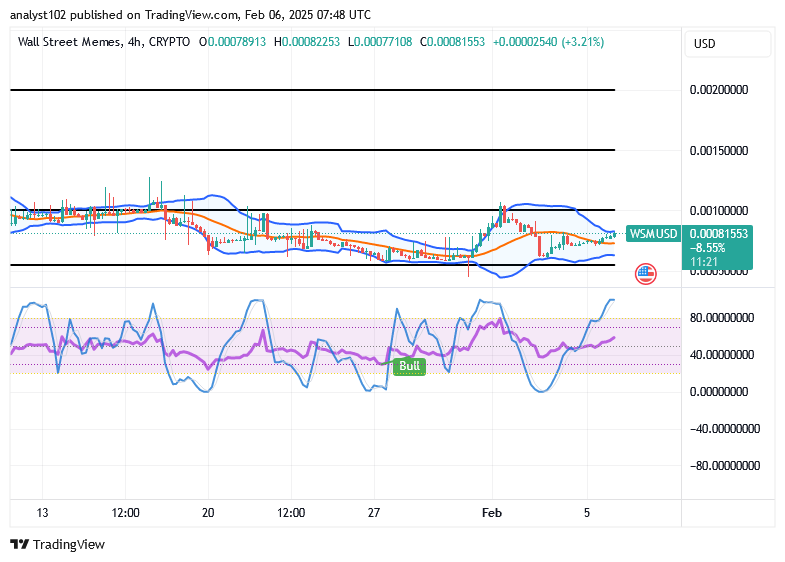
WSM/USD – 4-hour Chart
The WSM/USD market 4-hour chart shows that the crypto-economic marker currently makes moves, denoting hikes in inputs.
The stochastic oscillators have slowly and slantingly pushed northbound into the overbought region, indicating that bulls are likely going to get a relaxation mode in the proceedings of running positively further. The Bollinger Bands are yet to be getting a repositioning posture between the horizontal lines of $0.001 and $0.00055.
Would it be logically for bears to dwell on any attempt to reverse the moves as the WSM/USD trade touches the upper Bollinger Band now?
Based on the level of the WSM/USD market tending to reverse from $0.00081553 or thereabouts, it is not ideally technical to rely long on any attempted moves to the downside, given that the crypto-economic price makes moves, denoting hikes.
As it is at the moment, long-position movers at large are expected to continue to mount forces in order to foster steady rebounding pushes to create variant breakthroughs to the upside. Seeing or hoping that the base economy will for long suffer a decline in search for an all-time low won’t occur.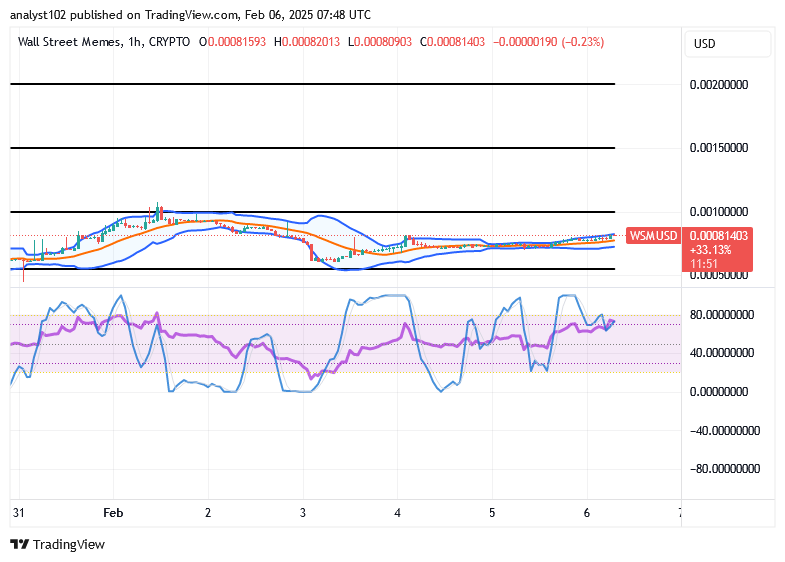
WSM/USD 1-hour chart
The 1-hour chart showcases that the WSM/USD trade makes moves, denoting hikes in inputs.
Since the Bollinger Bands are positioned just to the north below the $0.001 value line, assuming that sellers will dominate the market for the long run because there is no indication of a clear direction from the hourly setup’s overall technical outlook may only lead to short-term indecision. Around 80; the stochastic oscillators are located. We advise that the purchase strategy be maintained.
The end of staking is near. For more currency updates in the future, follow @WSMCasino.
The rewards will expire on February 7th, but you can still claim them until February 21st. After the 21st, any awards that remain unclaimed will be burnt.
Heads up $WSM holders.
— Wall Street Memes (@wallstmemes) February 6, 2025
Staking is coming to an end. Follow @WSMCasino for future coin updates.
Rewards will end on the 7th, you can claim up until the 21st of Feb. Any unclaimed rewards after the 21st will be burned.https://t.co/CiduXK4vBh pic.twitter.com/Uc6ajVZacV
Buy and stake WSM now!: Wall Street Meme (WSM)