Wall Street Memes (WSM) Price Stays Still, Gains Ahead
Estimated Reading Time: 3 minutes
Don’t invest unless you’re prepared to lose all the money you invest. This is a high-risk investment and you are unlikely to be protected if something goes wrong. Take 2 minutes to learn more

Wall Street Memes Price Prediction – November 11
The WSM/USD market saw light trading as recent profit-taking eased momentum. Buyers accumulated near key support while sellers paused, creating consolidation that hints at renewed strength and a potential upside move in upcoming sessions.
The WSM/USD market witnessed reduced volatility as short-term traders took profits, allowing the price to stabilize near established support zones. This consolidation phase reflects strong hands accumulating positions, signaling growing investor confidence. Sustained buy interest and steady liquidity suggest that long-term holders may be positioning early for a potential recovery and extended bullish cycle.
WSM/USD Market
Key Levels
Resistance levels: $0.0006, $0.0007, $0.0008
Support levels: $0.00035, $0.0003, $0.00025
WSM/USD – 4-hour Chart
The WSM/USD medium-term chart shows the crypto trade remaining stable, indicating market equilibrium with underlying bullish sentiment and potential gains ahead.
The Stochastic Oscillators have moved sharply upside, swinging freely in the overbought region with only a mere bearish sign visible for traders. The Bollinger Band trend lines are tactically realigning carefully to reflect a rising market volatility and potential upward momentum.
Could The Current WSM/USD Consolidation Signal A Strong Accumulation Phase Before The Next Uptrend?
Currently, the WSM/USD trade consolidation likely indicates accumulation. Sustained support levels, stable momentum, and gradual volume upticks suggest bullish sentiment building, potentially setting the stage for a forthcoming upward breakout.
The ongoing WSM/USD consolidation phase appears to signal a strong accumulation period. The price stability around key support zones, coupled with gradually increasing trading volume and narrowing volatility, suggests that buyers are regaining control. This steady buildup of momentum may precede a bullish breakout, potentially marking the start of a sustained upward trajectory.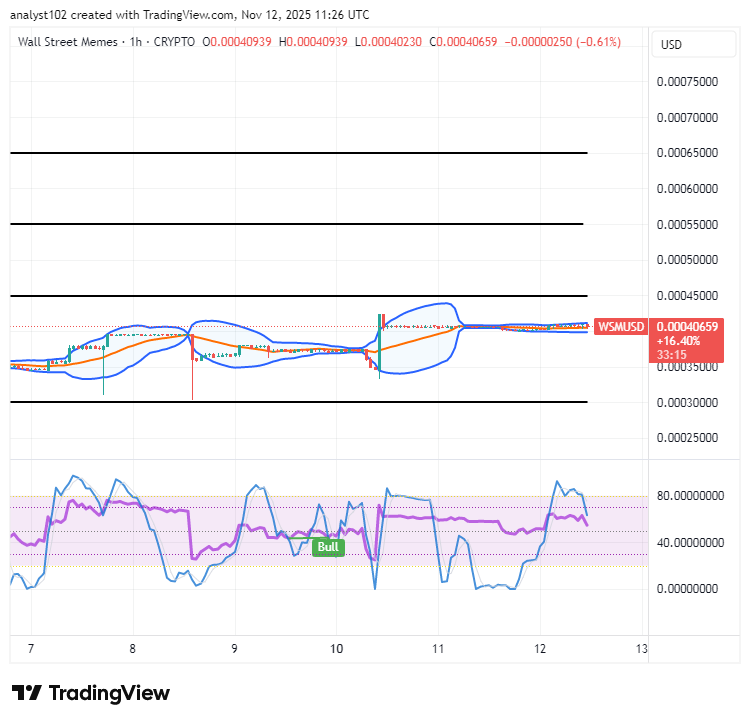
WSM/USD 1-hour chart
The WSM/USD short-term chart showcases the base crypto trade staying still and gaining ahead.
The Bollinger Bands are steadily aligning with successive price rises, clearly signaling strengthening upward momentum and expanding market volatility in favor of buyers as price action tests higher resistance levels. Meanwhile, the Stochastic Oscillators indicate that purchasers are gradually regaining strength, preparing to reassert control and further support the continuation of the prevailing bullish trend.
$WSM community, we saw your Tweets!
Thanks for your patience and strong support!
$WSM / $USDT is now tradeable on #Bybit Perpetuals.
$WSM community, we saw your Tweets! 👏$WSM / $USDT is now tradeable on #Bybit Perpetuals.
— Bybit (@Bybit_Official) October 13, 2023
Trade here: https://t.co/le4XyVyXaZ
Also want your project listed? Share your suggestions here:https://t.co/W7EWJVVNV5 https://t.co/XgXoL7g0rF