Wall Street Memes (WSM) Trade Holds Firm, Uptrend Reignites
Estimated Reading Time: 4 minutes
Don’t invest unless you’re prepared to lose all the money you invest. This is a high-risk investment and you are unlikely to be protected if something goes wrong. Take 2 minutes to learn more

Wall Street Memes Price Prediction – November 10
Strong investor sentiment, renewed market liquidity, and rising retail participation have bolstered Wall Street Memes (WSM). Strategic token buybacks and expanded exchange listings have stabilized trading activity, sparking fresh bullish momentum and reigniting upward price spirals across the market.
Wall Street Memes (WSM) continues to display resilient price action, maintaining stability despite broader market fluctuations. The asset’s medium-term structure reflects a reinforced support zone, where steady accumulation and bullish divergence suggest renewed investor confidence. Momentum indicators are gradually aligning with positive sentiment, signaling potential upside continuation. As liquidity improves and buying pressure intensifies, WSM appears poised to reclaim higher resistance levels, reaffirming its stronghold within the current market setup.
WSM/USD Market
Key Levels
Resistance levels: $0.0006, $0.0007, $0.0008
Support levels: $0.00035, $0.0003, $0.00025
WSM/USD – 4-hour Chart
The WSM/USD medium-term chart depicts the base crypto economy holding firm, reigniting price spirals against the US fiat currency.
The Bollinger Band trend lines are tactically realigning to reflect a rising market volatility. That indicates a potential breakout formation that could further confirm the ongoing bullish momentum while strengthening overall trading confidence. Meanwhile, the Stochastic Oscillators are steadily repositioning near a bullish threshold, signaling renewed market optimism and heightened buyer dominance across short-term trading zones.
How Might WSM’s Sustained Trading Strength Influence Short-Term Bullish Momentum and Trigger Renewed Price Spirals?
The WSM/USD market operation possesses trading strength to indicate growing market confidence, which could reinforce short-term bullish momentum, attract increased buying pressure, and potentially trigger renewed upward price spirals, supporting continued positive sentiment across both technical and retail trading zones.
WSM’s sustained trading strength reflects growing market confidence, reinforcing short-term bullish momentum and attracting increased buying pressure. This technical resilience supports backing long positions, allowing traders to capitalize on potential upward price spirals. By monitoring key support levels and momentum indicators, investors can strategically position themselves for continued gains. Overall, the setup favors sustained positive sentiment across retail and institutional trading zones.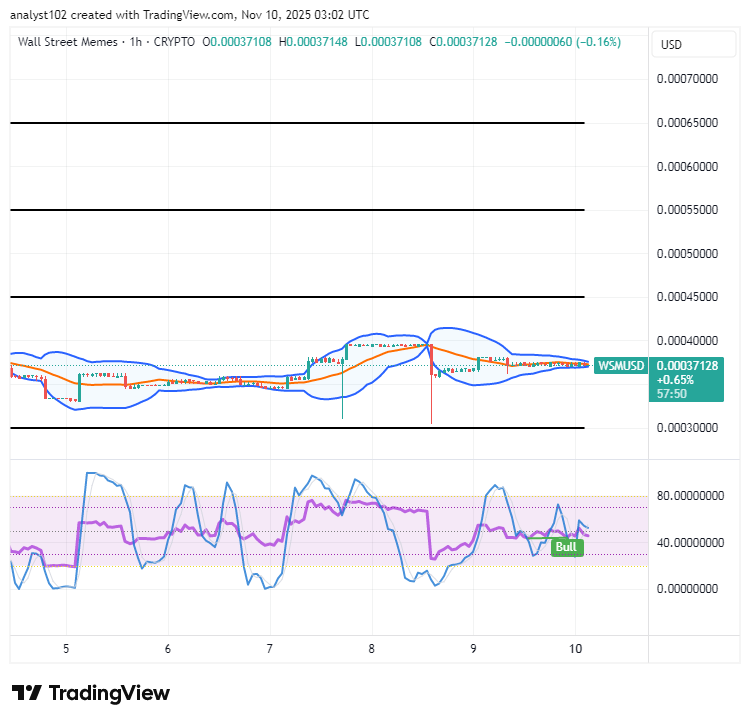
WSM/USD 1-hour chart
The WSM/USD short-term chart shows the base crypto-economic market holds firm, reigniting price spirals.
The Stochastic Oscillators indicate that buyers are gradually regaining strength, preparing to reassert control and support the continuation of the prevailing bullish trend. Meanwhile, the Bollinger Bands are aligning with successive price rises, signaling strengthening upward momentum and expanding market volatility in favor of buyers as price action tests higher resistance levels.
Attention $WSM community!
$WSM / $USDT is now available for trading on #Bybit Perpetuals.
Join the market and start trading today:
[https://i.bybit.com/1Wab4K3z](https://i.bybit.com/1Wab4K3z)
$WSM community, we saw your Tweets! 👏$WSM / $USDT is now tradeable on #Bybit Perpetuals.
— Bybit (@Bybit_Official) October 13, 2023
Trade here: https://t.co/le4XyVyXaZ
Also want your project listed? Share your suggestions here:https://t.co/W7EWJVVNV5 https://t.co/XgXoL7g0rF
Buy and stake WSM now! https://wallstmemes.com/