Wall Street Memes (WSM) Trade Finds a Base, Making Spirals
Estimated Reading Time: 3 minutes
Don’t invest unless you’re prepared to lose all the money you invest. This is a high-risk investment and you are unlikely to be protected if something goes wrong. Take 2 minutes to learn more
Wall Street Memes Price Prediction – March 14
It is noteworthy that the general behavioral actions that have been surfacing between bulls and bears in the market lines indicate that the Wall Street Memes coin and the valuation of the American currency have persistently let there be a formidable room for positions to stake a base, given that the crypto-economic trade now finds a base, making spirals.
As the WSM/USD market has yet to experience aggressive rebounds over the past few sessions, it technically suggests that investors still have an opportunity to accumulate positions at relatively lower levels before the anticipated bounce-offs materialize. The current downside has placed the market between the $0.001 and $0.008 range, providing another window for positioning before the next potential upswing.
WSM/USD Market
Key Levels
Resistance levels: $0.002, $0.0025, $0.003
Support levels: $0.0008, $0.0006, $0.0004
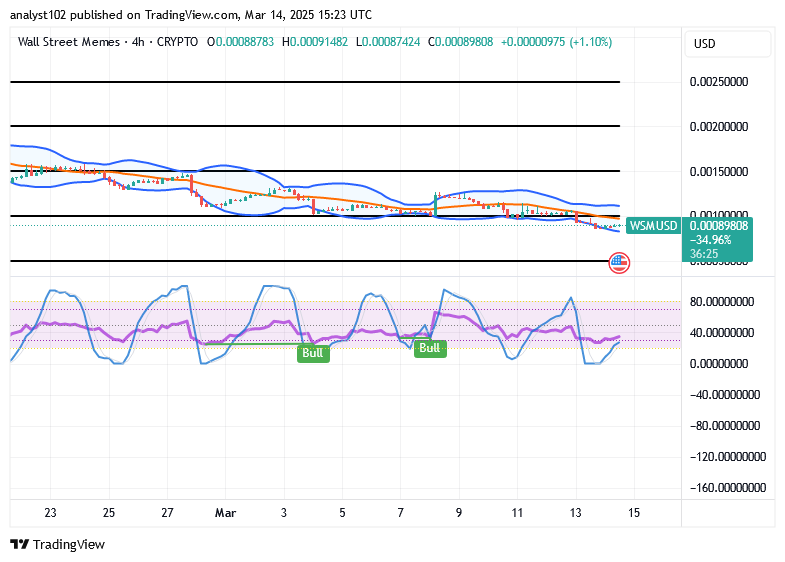
WSM/USD – 4-hour Chart
The medium-term chart of the WSM/USD trade, as of this writing, showcases that the crypto market finds a base, making spirals.
The stochastic oscillators have stepped southbound into the oversold region, attempting to swerve back to the north as they are kept within the area. That shows that recouping processes are still on. The Bollinger Bands trend lines are in a mood of reshaping postures toward indicating decent longing position orders.
Will the WSM/USD market keep deepening its dips in lower forms on the basis of bullish threshold signs that the oscillating tools portend?
A reaffirmation of expecting to see rises has been over time depicted by the oscillators to signify that some other lower lows being exercised in the activities of the WSM/USD market are tenable not to gain stances in the long-term running mode, as the crypto-economic market finds a base, making spirals.
With the formation pattern of the candlesticks around the lower part of the Bollinger Band, it is indicated that lower highs are surfacing, suggesting a potential accumulation phase to allow position staking and creating an optimistic outlook toward breaking through key resistances and achieving bullish continuation in the long run.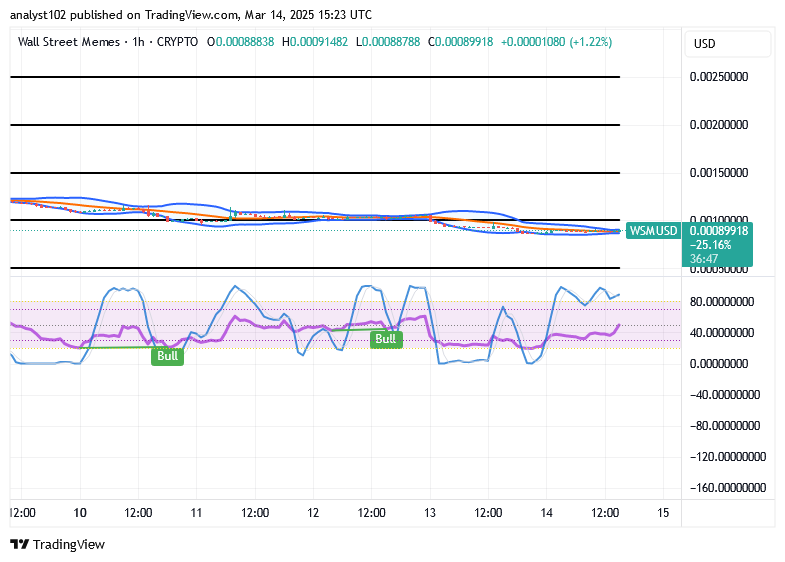
WSM/USD 1-hour chart
The 1-hour chart of the WSM/USD trade showcases that the crypto-economic trade finds a base, making spirals in its input.
It should be noted that the indicators strongly suggest the WSM/USD market bulls are intensifying their efforts, as the trend lines of the Bollinger Bands appear to be forming a bullish flag pattern. The stochastic oscillators have oscillated through various peaks and troughs, frequently moving between the oversold and overbought regions. However, they continue to maintain a bullish trade signal, reinforcing the positive market outlook.
Me: picks up the dip
Me: *buys the dip*
— Wall Street Memes (@wallstmemes) March 15, 2025
Chart 0.001 seconds later: pic.twitter.com/DObzO1b7Sq
Buy and stake WSM now!