Wall Street Memes (WSM) Trade Is Cooling, Set for Spirals
Estimated Reading Time: 3 minutes
Don’t invest unless you’re prepared to lose all the money you invest. This is a high-risk investment and you are unlikely to be protected if something goes wrong. Take 2 minutes to learn more

Wall Street Memes Price Prediction – August 12
The Wall Street Memes coin is showing a stable pattern near key support levels, suggesting that it is cooling down before possibly making big price moves against the US dollar, as the price is ready for changes in its movement.
Such sustained stability around critical support thresholds reflects an accumulation phase, logically implying that market participants are positioning for a significant shift, with underlying momentum gradually primed to trigger pronounced price swings in the near-term valuation of Wall Street Memes coin against the US dollar.
WSM/USD Market
Key Levels
Resistance levels: $0.0008, $0.0009, $0.001
Support levels: $0.0005, $0.0004, $0.0003
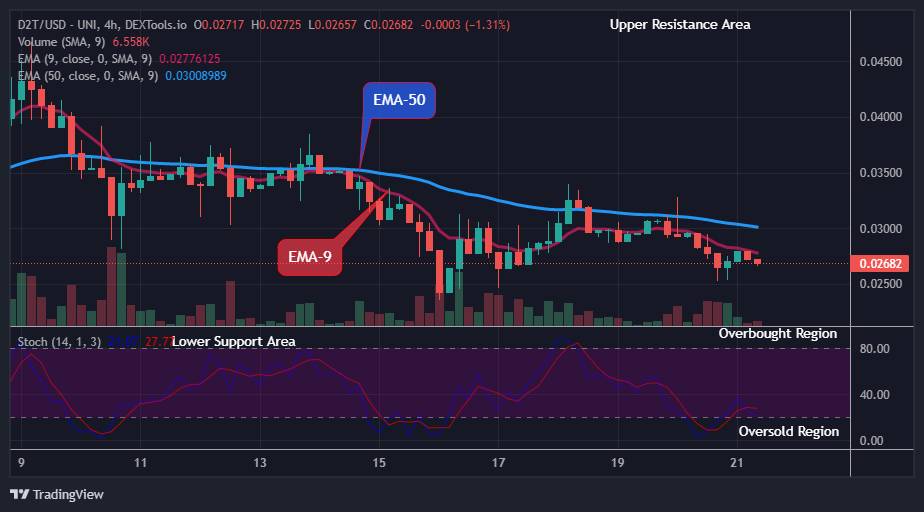
WSM/USD – 4-hour Chart
The WSM/USD medium-term chart depicts that the crypto-economic trade is currently cooling down, settling for spirals.
The stochastic oscillators are steadily swerving positively in the overbought region by maintaining a bullish threshold signal, reinforcing heightened upward momentum prospects. The Bollinger Bands remain narrowly aligned eastward, closely trailing just beneath the $0.0006 trade line, indicating compressed volatility before potential breakout expansion.
Could the Cool Wall Street Memes Trade Trigger Adverse Spirals in Market Momentum?
While short-term spirals may occur, the cooling phase can consolidate strength and stabilize price action, offering long-term position holders in the WSM/USD market a strategic advantage as underlying fundamentals and market sentiment align for future upward spirals.
The present cooling phase in the WSM/USD market signifies healthy consolidation, enhancing structural stability and building latent bullish pressure, thereby positioning long-term holders advantageously to capitalize on potentially sustained upward spirals once momentum decisively reasserts itself in line with supportive fundamentals.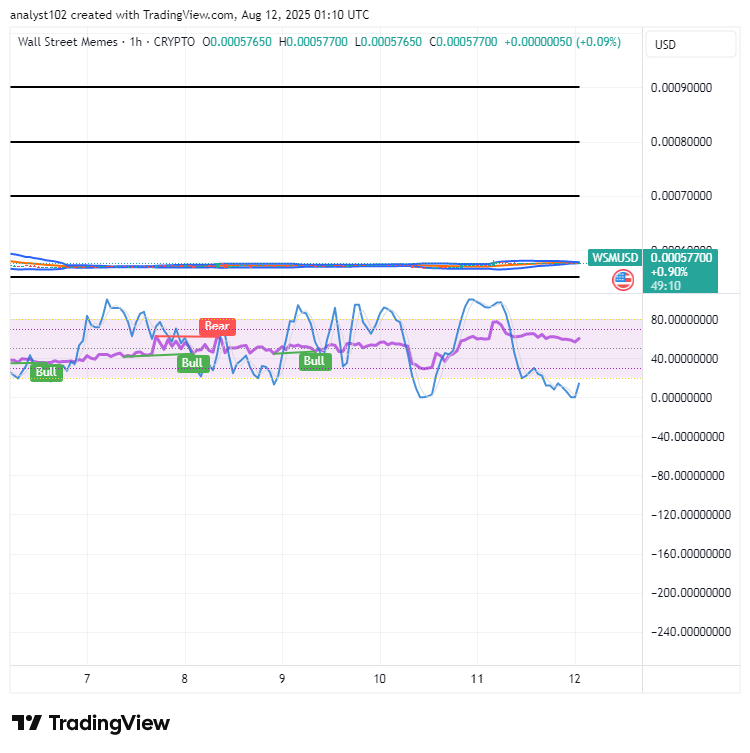
WSM/USD 1-hour chart
The 1-hour chart of the WSM/USD market is cooling in its movement texture, settling for potential spirals.
The Bollinger Bands are staying tight and moving sideways, showing that the price is still stuck in a steady range with low volatility but building pressure. Right now, the stochastic oscillators have dropped into the oversold zone, suggesting that buying interest is quietly rebuilding from the ground up.
In the past 24 hours, $WSM and its community faced a coordinated hack, primarily targeting the Discord channel.
Over the last 24 hours, The $WSM token and community has undergone a coordinated attack. The hackers specifically targeted our Discord community.
— Wall Street Memes (@wallstmemes) October 12, 2023
We reiterate that no one from the Wall St Memes team will ever direct message you first, or ask for any personal information – even… pic.twitter.com/VwySpXC7cz