Wall Street Memes (WSM) Trade Is Down, Ready to Catapult
Estimated Reading Time: 3 minutes
Don’t invest unless you’re prepared to lose all the money you invest. This is a high-risk investment and you are unlikely to be protected if something goes wrong. Take 2 minutes to learn more

Wall Street Memes Price Prediction – October 25
The Wall Street Memes (WSM) coin, paired with the U.S. dollar (USD), has demonstrated a structured and strategic operational movement within the broader digital asset market. Following a calculated pullback phase, the asset appears to be consolidating its base in preparation for a renewed upward momentum.
Recent market activities suggest that the project’s strategic retreat has strengthened long-term investor confidence, allowing the WSM/USD pair to establish a firmer support level. This correction phase aligns with the coin’s broader operational framework, which emphasizes sustainable market positioning and organic growth over short-term volatility.
WSM/USD Market
Key Levels
Resistance levels: $0.0006, $0.0007, $0.0008
Support levels: $0.0004, $0.0003, $0.0002
WSM/USD – 4-hour Chart
The WSM/USD medium-term chart showcases that the crypto-economic market pulls back, ready to catapult higher.
The Bollinger Bands indicators have tactically stretched southward to re-base around the trade lines marked at $0.0004, reflecting mild market stabilization. The Stochastic Oscillators are swinging within the overbought region, indicating that selling pressure is decreasing, while momentum strength gradually cools amid cautious bullish optimism.
How Has WSM/USD’s Strategic Retreat Boosted Investor Confidence and Strengthened Long-Term Market Support?
WSM/USD’s strategic retreat reinforced investor confidence by forming a stronger support base and curbing volatility. This controlled correction aligns with its long-term growth vision, emphasizing market stability and sustainable upward momentum within the broader crypto landscape.
In the long-term view, the WSM base structure remains positive, underpinned by improved liquidity, enhanced community engagement, and increasing visibility across major trading platforms. These operational fundamentals, combined with favorable sentiment from retail and speculative traders, point toward a potential upward breakout in the coming sessions.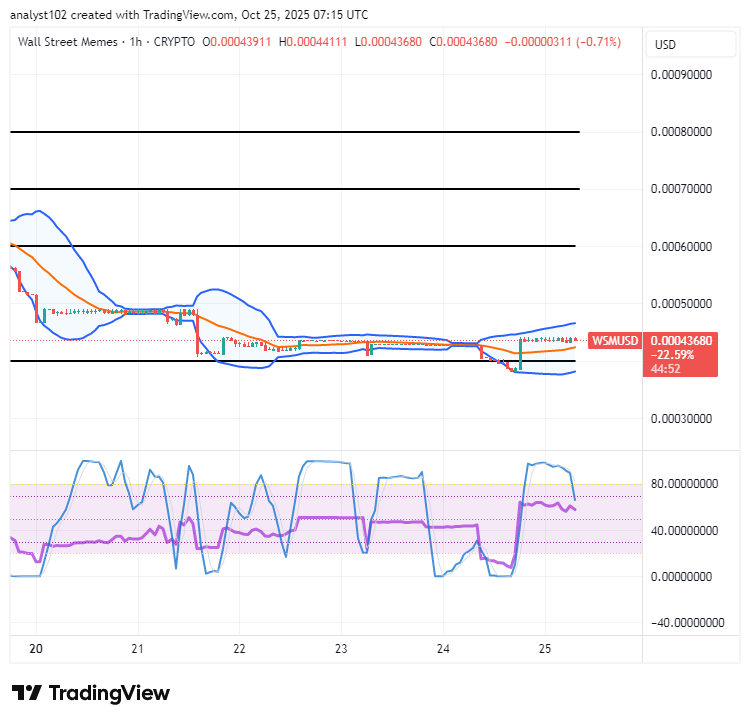
WSM/USD 1-hour chart
The WSM/USD 1-hour chart demonstrates that the crypto-economic market has pulled back strategically and now appears poised to catapult higher.
The Stochastic Oscillators have entered the overbought region, suggesting a potential momentum consolidation phase as the market attempts to reclaim upward strength and sustain bullish continuity. Concurrently, the Bollinger Bands are expanding moderately above the $0.0004 support level, reflecting heightened volatility, intensified price compression, and a possible volatility breakout setup in the near term.
$WSM community, we saw your Tweets!
$WSM / $USDT is now officially tradeable on #Bybit Perpetuals today!
$WSM community, we saw your Tweets! 👏$WSM / $USDT is now tradeable on #Bybit Perpetuals.
— Bybit (@Bybit_Official) October 13, 2023
Trade here: https://t.co/le4XyVyXaZ
Also want your project listed? Share your suggestions here:https://t.co/W7EWJVVNV5 https://t.co/XgXoL7g0rF