Wall Street Memes (WSM) Price Eases Down, Poised to Jump
Estimated Reading Time: 3 minutes
Don’t invest unless you’re prepared to lose all the money you invest. This is a high-risk investment and you are unlikely to be protected if something goes wrong. Take 2 minutes to learn more

Wall Street Memes Price Prediction – October 24
The WSM/USD market experienced mild corrections as traders engaged in short-term profit-taking after recent gains. Nonetheless, improved investor sentiment, positive crypto-market data, and potential liquidity inflows suggest the pair is poised for an imminent bullish rebound.
The WSM/USD trade recently witnessed a modest decline as traders booked profits following a strong rally. Despite the temporary price easing, underlying momentum remains positive. Renewed investor confidence, improving on-chain activity, and expectations of increased market liquidity collectively indicate that the pair is preparing for another upward swing, signaling potential bullish recovery ahead.
WSM/USD Market
Key Levels
Resistance levels: $0.0006, $0.0007, $0.0008
Support levels: $0.0004, $0.0003, $0.0002
WSM/USD – 4-hour Chart
It is on the WSM/USD medium-term chart that the crypto-economic price eases down, poised to jump.
The Stochastic Oscillators are in a mood of swinging in the overbought region, showing that selling velocities are on the decrease, while momentum strength gradually cools off. The Bollinger Bands indicators are trying to get re-positioned downward to reshape the lower ends where longing orders will thrive and spark fresh buying interest.
What Technical Indicators Suggest That The WSM/USD Market Price Is Poised To Jump Soon?
The WSM/USD market currently shows early signs of bullish resurgence as momentum indicators confirm renewed upward strength.
The WSM/USD market is showing renewed strength as bullish forces regain momentum after a brief correction. Buyers are steadily reclaiming dominance, and overall sentiment suggests the market may soon experience a sustained upward breakout toward higher and more stable price territories.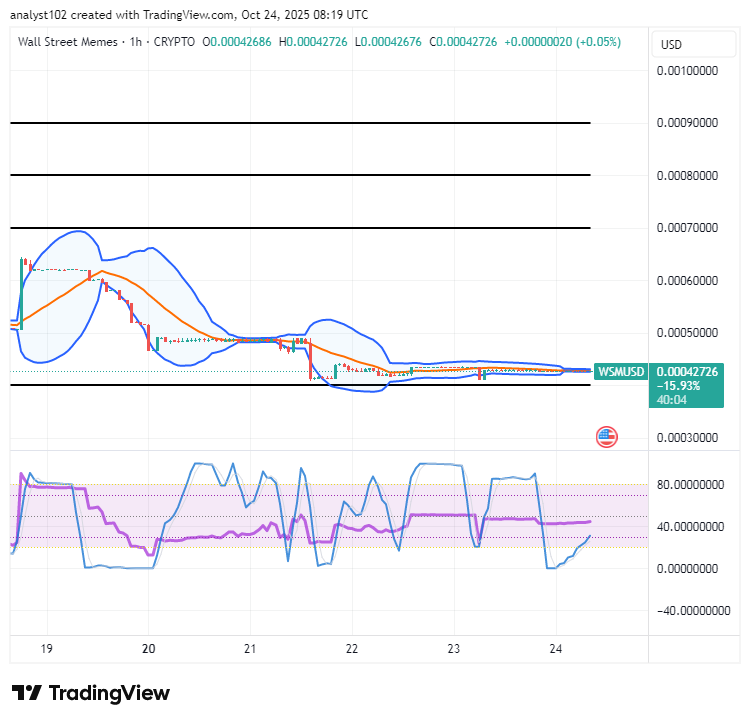
WSM/USD 1-hour chart
The WSM/USD 1-hour chart showcases that the crypto market eases down, poised to jump.
The Bollinger Bands are systematically widening in ranges slightly above the $0.0004 support level, signaling increased market volatility and potential buildup for a breakout. Meanwhile, the Stochastic Oscillators are attempting to turn upward from the oversold region, indicating an emerging recovery and possible bullish momentum formation.
Up to 43% APY is now available (at the time of posting).
Take advantage of this high-yield opportunity today:
Stake Now: [wallstmemes.com/en/dashboard](https://wallstmemes.com/en/dashboard)
Buy Now: [wallstmemes.com] (https://wallstmemes.com)
Don’t miss the chance to maximize your WSM earnings!
🔥 Up To 43% APY Now Available 🔥
— Wall Street Memes (@wallstmemes) October 8, 2023
(at the time of posting)
Stake Now ➡️ https://t.co/X031FQo0bW Buy Now ➡️ https://t.co/6zkwWf1VRF pic.twitter.com/o9qrY1zJn8