Wall Street Memes (WSM) Trade Reshapes, Eyeing a Rise
Estimated Reading Time: 3 minutes
Don’t invest unless you’re prepared to lose all the money you invest. This is a high-risk investment and you are unlikely to be protected if something goes wrong. Take 2 minutes to learn more

Wall Street Memes Price Prediction – November 8
Wall Street Memes coin versus the US dollar has begun to experience a brief pull-up after an initial downsize, with buyers stepping in near key support levels.
The increasing trading volume, along with stabilizing price action across key levels, indicates growing trader confidence and a gradual shift of momentum toward the bulls. If buying interest continues, WSM market operation is poised to gain traction, presenting strategic opportunities for cautious investors to capitalize on a potential short-term rally while closely monitoring critical resistance and support zones to confirm the sustainability of the upward movement.
WSM/USD Market
Key Levels
Resistance levels: $0.0006, $0.0007, $0.0008
Support levels: $0.00035, $0.0003, $0.00025
WSM/USD – 4-hour Chart
The WSM/USD medium-term chart reveals the crypto-economic trade deals are reshaping, as the price is eyeing a rise.
The Stochastic Oscillators have witnessed a notable bottom-shadowed candlestick through the trend lines, making the market get strong buying forces around $0.0004, attracting renewed trader interest and cautious optimism among short-term investors. In the meantime, the Stochastic Oscillators have traversed steadily northbound into the overbought region, signaling potential profit-taking and heightened market activity soon.
Is WSM Positioned to Rise as Short-Term EMAs Flatten and Trading Volume Strengthens?
The WSM/USD market’s activity is showing early resilience as short-term EMAs flatten and volume rises, indicating weakening selling pressure. If momentum continues, the coin may steadily recover, suggesting that recent pullbacks are losing strength and a bullish shift could be underway.
WSM’s short-term stability, supported by flattening EMAs and rising trading volume, points to diminishing downward pressure. This suggests that sellers are losing control, allowing buyers to gradually regain influence. If this trend persists, the coin could experience a steady rebound, offering traders a cautiously optimistic outlook for near-term upward movement.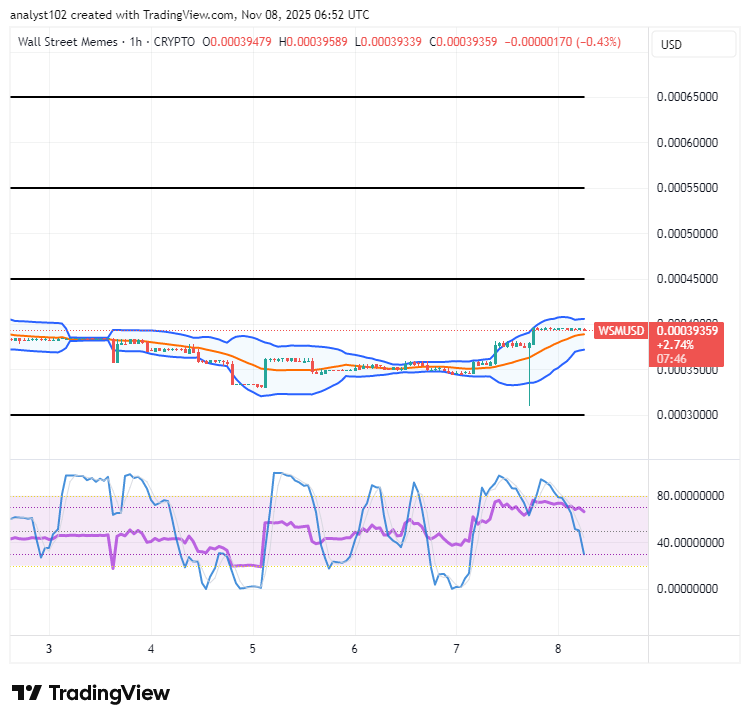
WSM/USD 1-hour chart
The WSM/USD short-term chart showcases that the crypto business operation is reshaping through key resistances, as the pairing market is actively eyeing a potential rise and renewed bullish momentum in the near term.
The Bollinger Bands have tactically positioned northward, aligning alongside rises and indicating strengthening upward momentum. The Stochastic Oscillators are in a brief southbound moving mood, signaling that buyers are making steady efforts to get re-energized in no time, supporting a potential continuation of the upward trend.
3 DAYS TO GO UNTIL A MASSIVE $1M OF BUYBACKS IS COMPLETED! Don’t Miss Out!
$WSM
Buy Now ➡️ [http://bit.ly/Twitter_WSM_BUY](http://bit.ly/Twitter_WSM_BUY)
If you want, I can also make a version more hype-driven for social engagement.
3 DAYS TO GO UNTIL A MASSIVE $1M OF BUYBACKS IS COMPLETED! 🔥 $WSM 🚀
— Wall Street Memes (@wallstmemes) October 8, 2023
Buy Now ➡️ https://t.co/ffr2clEknx pic.twitter.com/bs8uNKIp8D