Wall Street Memes (WSM) Trade Reverses, Stabilizing Base
Estimated Reading Time: 3 minutes
Don’t invest unless you’re prepared to lose all the money you invest. This is a high-risk investment and you are unlikely to be protected if something goes wrong. Take 2 minutes to learn more

Wall Street Memes Price Prediction – February 19
Every step being pushed to the moon side of the WSM/USD market operations has been steadily accomplished in a systemic pattern way, making some unguarded traders panic most times, given that the current financial situation now portends reverses, stabilizing bases even in the process.
The market’s ability to maintain an uptrend despite reversals highlights the ongoing influence of both buyers and sellers within the trading pair. The base instrument remains undervalued relative to its counterpart. Given this sentiment, the current trade zone presents an opportunity for strategic positioning ahead of potential substantial rebounds.
WSM/USD Market
Key Levels
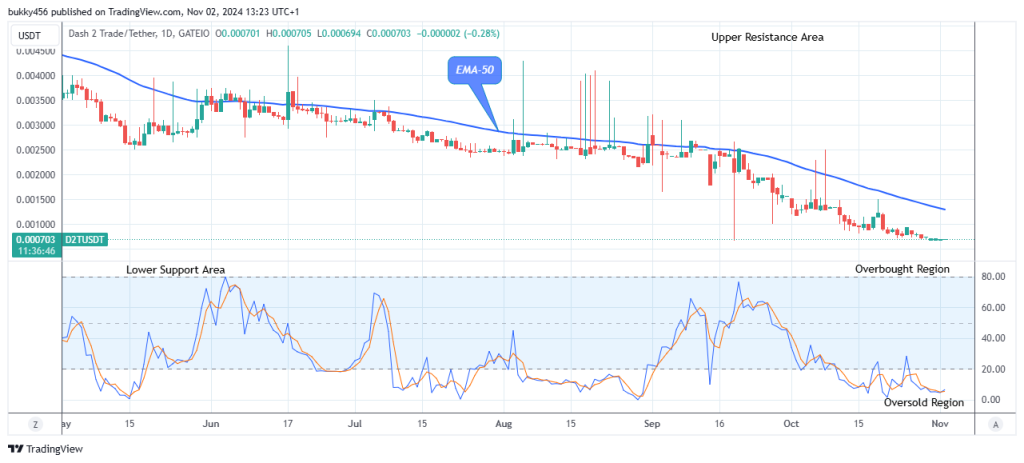
Resistance levels: $0.002, $0.0025, $0.003
Support levels: $0.0008, $0.0006, $0.0004
WSM/USD – 4-hour Chart
The medium-term chart (4-hour Chart) of the WSM/USD market transactions showcases that the crypto-economic trade reverses, stabilizing base in the processes.
Technically, the upward trajectory of the Bollinger Bands trend lines is positioned within elevated trading zones between $0.002 and $0.001, reflecting the strengthening of the base instrument against its counter. To counter further declines, the stochastic oscillators have moved into the oversold region, signaling potential reversal conditions.
Should buyers take advantage of the WSM/USD market’s current recovery at the middle Bollinger Band?
It is ideally portending that the bulls in the business transactions of the WSM/USD market take advantage of the attempting recovery forces around the middle Bollinger Band, as it shows now that the crypto-economic market reverses, stabilizing the base around the trade spots.
A smaller bullish candlestick is currently forming, indicating that buying activity for the base instrument is strengthening. The lower trend line of the indicators continues to act as a key support zone, where selling pressure is likely to subside unless buyers increase upward momentum steadily moving forward.
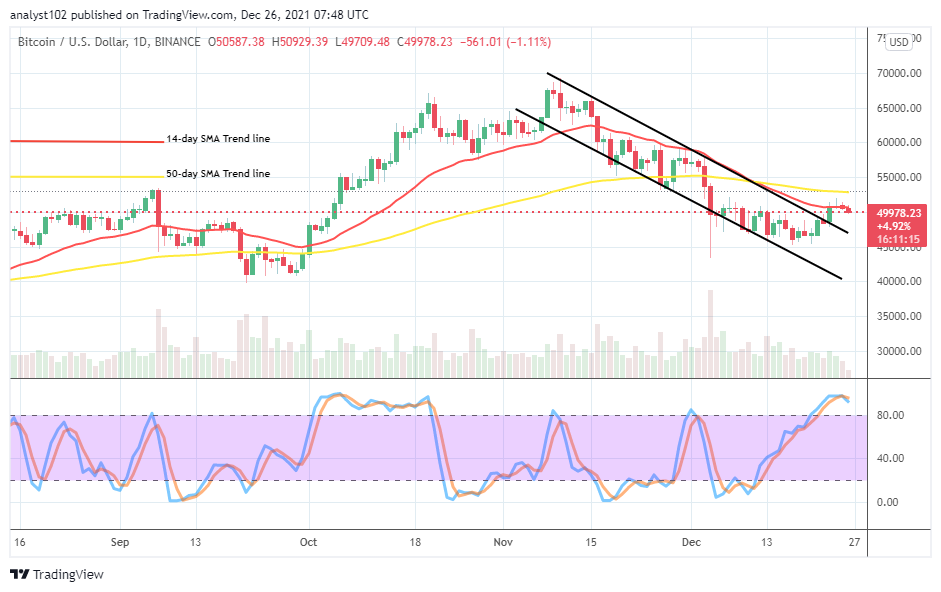
WSM/USD 1-hour chart
The 1-hour chart from the technical composure of the short-term setup showcases that the WSM/USD market reverses, stabilizing the base.
The Bollinger Bands indicators are repositioning upward, with the lower highs suggesting that buying pressure is building above the $0.001 level. Concurrently, the stochastic oscillators are attempting to rise from the oversold region, signaling an increase in upward momentum.
The worst timeline is the one on LinkedIn.
LinkedIn timeline is the worst timeline pic.twitter.com/6Aal3EK5oH
— Wall Street Memes (@wallstmemes) February 18, 2025
Buy and stake WSM now!: Wall Street Meme (WSM)