Wall Street Memes (WSM) Trade Wags Around, Nurturing Hikes
Estimated Reading Time: 3 minutes
Don’t invest unless you’re prepared to lose all the money you invest. This is a high-risk investment and you are unlikely to be protected if something goes wrong. Take 2 minutes to learn more

Wall Street Memes Price Prediction – April 25
The Wall Street Memes coin is exhibiting pronounced buying and selling pressures against the US dollar, with its valuation showing bearish momentum punctuated by corrective rebounds, as the price wags around, nurturing hikes.
A broader range of promising opportunities has emerged from signal cues, highlighting that price interactions with the lower Bollinger Band frequently trigger renewed buying interest, hinting at imminent upward trends. Given the oscillators’ stance in oversold territory alongside the formation of a modest bullish candlestick, conditions appear ripe for a foundational buildup, setting the stage for a potential bullish market turnaround.
WSM/USD Market
Key Levels
Resistance levels: $0.0015, $0.002, $0.0025
Support levels: $0.0007, $0.0006, $0.0005
WSM/USD – 4-hour Chart
The medium-term chart (4-hour chart) of the WSM/USD market demonstrates that the crypto-economic trade wags around, nurturing hikes.
The Bollinger Bands indicators have remained optimistically placed eastward closely below the $0.001 mark, showing signs of consolidating with limited upward pressure and potential breakout formation. The stochastic oscillators have gradually swerved southbound into the deeply oversold region, signaling the increasing possibility of a bullish reversal, upward correction, and momentum shift in the near term.
With WSM/USD trading below $0.001, could upcoming movements signal a potential shift in momentum?
The WSM/USD market has been charting a descending channel pattern, characterized by a series of lower highs and marginally lower lows—an indication that bullish participants are gradually accumulating strength, given that the price wags around, nurturing hikes.
In this regard, traders within the WSM/USD market landscape are encouraged to remain patient and optimistic, as the base instrument appears poised to resume massive rallies in the near future. This bullish sentiment is confidently expected to unfold subtly yet powerfully at any moment. Long-term holding of well-positioned entries should remain the guiding principle in the trading approach, ensuring consistent and sustained growth potential.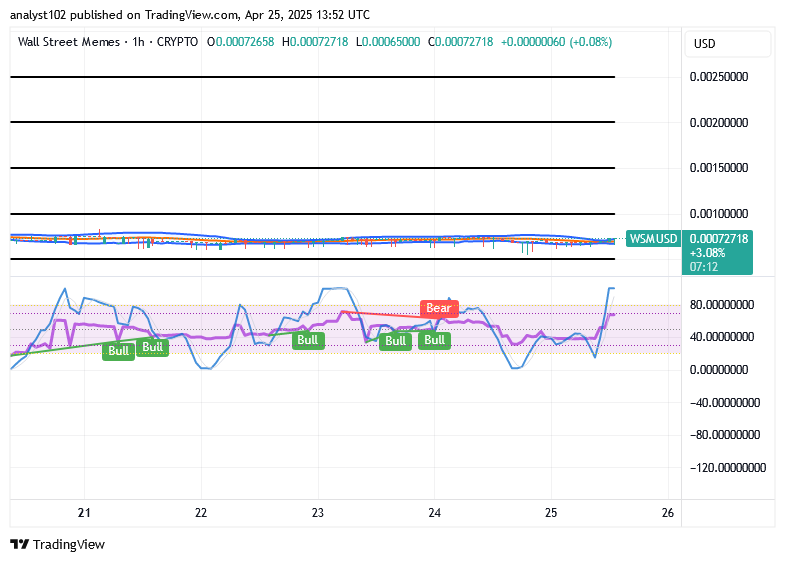
WSM/USD 1-hour chart
The technical outputs of the WSM/USD market based on hourly perspectives show that the trade wags around, nurturing hikes.
The Bollinger Bands indicate a series of lower lows in the recent price action, suggesting continued volatility and trend weakness. Meanwhile, the stochastic oscillators have shifted northbound into the overbought region, raising subtle bearish divergence signals and cautioning against expecting sustained, smooth upward price movements without a corrective consolidation or volume confirmation.
$WSM community, your Tweets has triggered notable sentiment shifts, increasing bullish traction, social volume, and momentum potential across the trading landscape!
$WSM community, we saw your Tweets! 👏$WSM / $USDT is now tradeable on #Bybit Perpetuals.
— Bybit (@Bybit_Official) October 13, 2023
Trade here: https://t.co/le4XyVyXaZ
Also want your project listed? Share your suggestions here:https://t.co/W7EWJVVNV5 https://t.co/XgXoL7g0rF