Wall Street Memes (WSM) Trades Dips Briefly, Builds for Up Move
Estimated Reading Time: 4 minutes
Don’t invest unless you’re prepared to lose all the money you invest. This is a high-risk investment and you are unlikely to be protected if something goes wrong. Take 2 minutes to learn more

Wall Street Memes Price Prediction – November 1
After a short correction phase, Wall Street Memes (WSM) displayed mild retracement signals as buyers cautiously regained interest. The token’s recent pullback near support zones hints at renewed momentum, suggesting potential buildup for another upward leg once bullish forces strengthen again.
Wall Street Memes (WSM) is showing signs of a strong comeback! After a short dip, buyers are stepping back in, fueling optimism for another upward breakout. The price action around key support zones suggests momentum is building fast—a perfect moment for traders to position early before the next bullish surge begins.
WSM/USD Market
Key Levels
Resistance levels: $0.0006, $0.0007, $0.0008
Support levels: $0.00035, $0.0003, $0.00025
WSM/USD – 4-hour Chart
The WSM/USD medium-term chart shows that crypto-economic trades briefly dip before indicating a potential upward movement.
The Bollinger Bands are steadily and gradually widening further, clearly indicating a rise in market volatility and a persistent, consistent downward drive toward the lower trading zone, as relatively lesser yet ongoing selling pressure continues to develop and form over time. Meanwhile, the Stochastic Oscillators have gently descended deeply into the oversold region, strongly implying that bullish forces may soon regain dominance once again, potentially sparking a significant and sustained upward recovery phase ahead.
Could WSM’s Brief Dip Be Signaling a Solid Accumulation Phase for Sustained Long-Term Gains?
WSM’s economic market brief dip appears to be a healthy correction within an ongoing bullish structure. The steady rebound momentum and renewed buying interest suggest strong investor confidence, supporting the likelihood of sustained growth and long-term value appreciation ahead.
The US dollar’s recent firmness created a short-lived pullback in WSM’s economic valuation, allowing the market to reset after previous gains. However, WSM’s resilience above key support levels and renewed bullish sentiment indicate strong accumulation. This stability positions WSM for a potential sustained uptrend as momentum builds and traders anticipate a rebound against the strengthening dollar.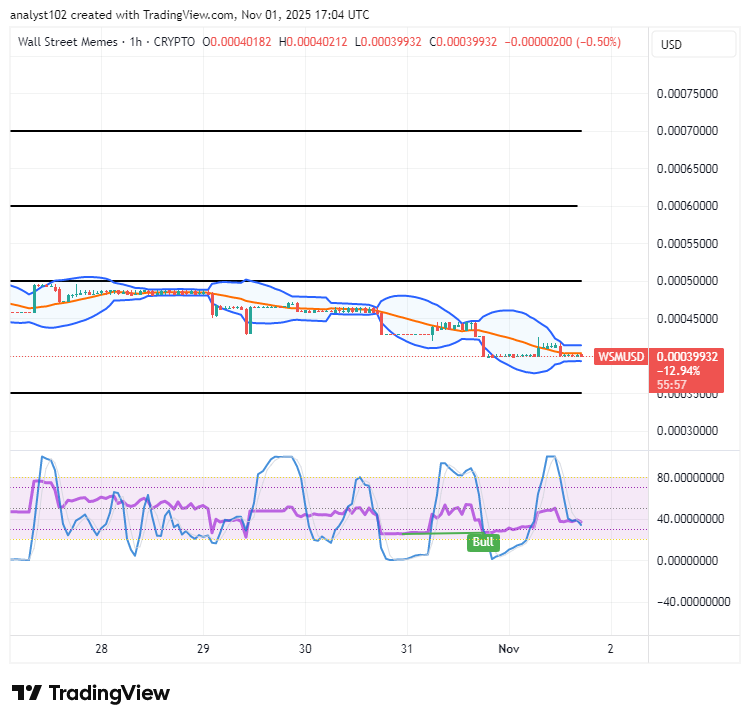
WSM/USD 1-hour chart
The WSM/USD short-term chart showcases the crypto business operation dipping briefly and building for up moves.
The Bollinger Bands are trending downward, positioning the market for potential recovery entries from lower zones, while suggesting a possible volatility squeeze that could spark renewed momentum and inspire strategic long-position buildups in the near term. The Stochastic Oscillators have formed a bullish threshold pattern, signaling that buying forces are preparing to take a decisive lead in the near future, with traders likely anticipating a favorable breakout scenario.
Up To 43% APY Now Available (at the time of posting) — Earn Big Rewards Today!
Stake Now ➡ [https://wallstmemes.com/en/dashboard](https://wallstmemes.com/en/dashboard)
Buy Now ➡ [https://wallstmemes.com](https://wallstmemes.com)
🔥 Up To 43% APY Now Available 🔥
— Wall Street Memes (@wallstmemes) October 8, 2023
(at the time of posting)
Stake Now ➡️ https://t.co/X031FQo0bW Buy Now ➡️ https://t.co/6zkwWf1VRF pic.twitter.com/o9qrY1zJn8