Wall Street Memes (WSM/USD) Price Is Lows, Nurturing Rises
Estimated Reading Time: 3 minutes
Don’t invest unless you’re prepared to lose all the money you invest. This is a high-risk investment and you are unlikely to be protected if something goes wrong. Take 2 minutes to learn more

Wall Street Memes Price Prediction – January 20
It is indicated that the WSM/USD market has been allowed to go for a shift in the hands of bears on a lighter mode, as the crypto-economic valuation extends lows, nurturing rises.
Before collecting impetus to push northward on the route of rebounding, the price movements must be more active on the negative side in an attempt to reach an all-time low point. A set of bullish candlesticks is currently forming, indicating that purchasing forces are about to make a surprise return that market capitalists of the WSM/USD should not allow passing.
WSM/USD Market
Key Levels
Resistance levels: $0.0012, $0.0017, $0.0022
Support levels: $0.0007, $0.0005, $0.0003
WSM/USD – 4-hour Chart
The WSM/USD market 4-hour chart reveals that the crypto-economic market extends lows, nurturing rises in inputs to the point of $0.0006.
There have been occurrences of notable two 4-hour candlesticks, formidably signifying that long-term position movers are gearing up muscles from the lower end of the Bollinger Bands indicators as of this analysis. The stochastic oscillators have in the recent past traversed southbound into the oversold region before repositioning northbound between 20 and 40 lines.
Given that the WSM/USD market extends lows, should long-term position pushers cease launching longing orders?
It should be technically considered as a golden opportunity to have a series of buying positions whenever a situation like seeing the Wall Street Memes going down occurs, as the crypto market extends lows, nurturing rises in its signal formation.
Given that the market is already underpriced for an extended period of time, buyers of the base instrument are required to be putting on muscle since the circumstance foreshadows that the counter trading tool is having its ways. It makes sense for buyers to keep buying and holding their holdings in order for them to last for a long time because of that presupposition. Should long-term position pushers stop placing longing orders now that the WSM/USD market is extending lows?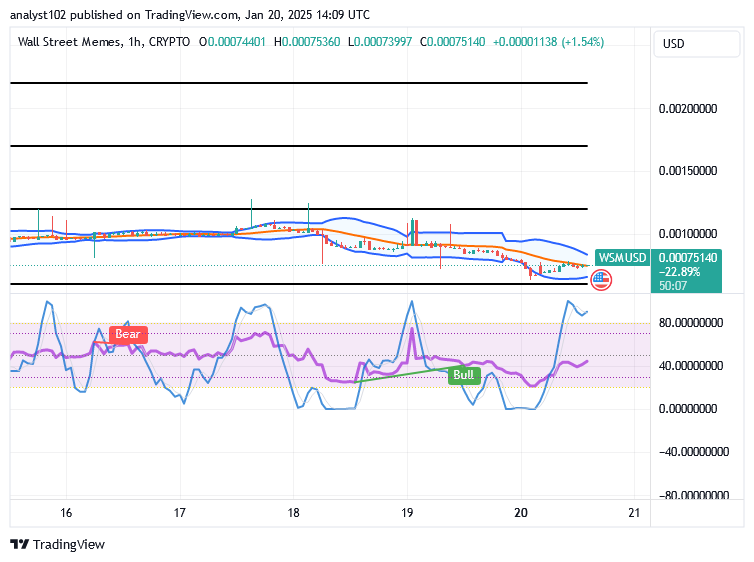
WSM/USD 1-hour chart
The 1-hour chart showcases that the WSM/USD trade extends lows, nurturing rises in inputs.
In the overbought area, the stochastic oscillators have been seen exhibiting distinct swerving-through systems of the variation values with a bullish prospective signal note. The Bollinger Bands’ trend lines have essentially given way to a downward pressure, forming a bullish flag-like pattern. The fact that investors shouldn’t postpone market deals is therefore positive.
Buy and stake WSM now!: Wall Street Meme (WSM)
After selling, Jeets watches a memecoin soar 0.2 seconds.
Jeets watching a memecoin rocket 0.2 seconds after selling pic.twitter.com/C0eZ4nCoyd
— Wall Street Memes (@wallstmemes) January 19, 2025