Cardano (ADA/USDT) Faces Strong Resistance as Price Struggles to Hold Above Critical Level
Estimated Reading Time: 3 minutes
Don’t invest unless you’re prepared to lose all the money you invest. This is a high-risk investment and you are unlikely to be protected if something goes wrong. Take 2 minutes to learn more
In the last 24 hours, Cardano against Tether has seen a 2.1% decrease in participation compared to the previous session. However, the price seems to be growing, recording 0.54% over the previous trade, but these gains have not changed the sentiment around the market as the price continues to hover below $0.5900.
As it stands, the pair seems to be getting positive actions, all thanks to the midnight bullish impact on the market. Will Cardano make it back above $0.6147 even as the Stochastic RSI shows mixed signals across different time zones with rising volumes?
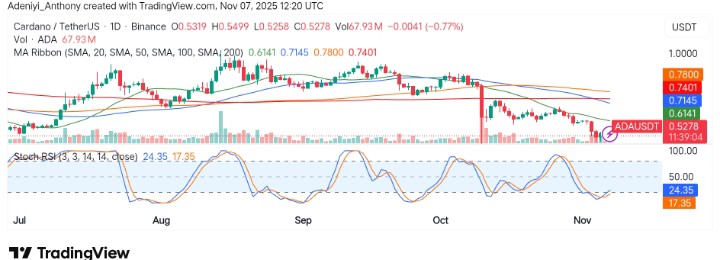
Currently, Cardano trades at $0.5276 with more than 69 million traded volumes on the daily timeframe.
Technical Indicators
Major Resistance Levels: $0.6147, $0.7148, and $7802
Major Support Levels: $0.5270, $0.5000, and $0.4500
Technical Analysis
Technically, Cardano against Tether on the daily timeframe has been facing strong resistance below significant critical moving averages in the recent weeks. As it stands, the price has dropped below the moving average ribbons, suggesting the pair is largely oversold. However, it appears that things are changing at the moment, as the Stochastic RSI seems to be advancing from the oversold level.
To this end, sustained momentum—if the current support level is broken, the $0.5000 will be tested—but an increased participation that can shift the price above $0.6147 would shift the market sentiment.
Cardano Hoping for a Comeback?
So far, Cardano has been under strong pressure, acting below Wednesday’s high. At the moment, it appears a meaningful low has formed, but a more bullish effort is needed to break above the $0.5900 level.
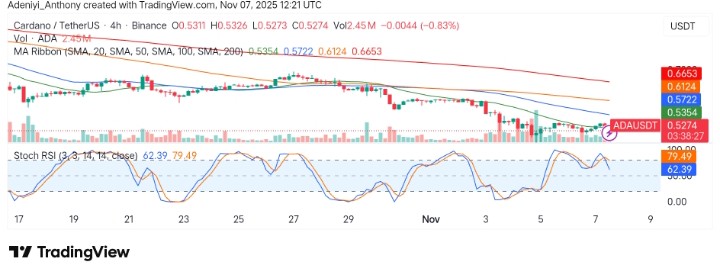
ADA/USDT Analysis: Could This Be a Sign of Rebound?
On the 4-hour chart, ADA/USDT has recently shown a sign of bullish momentum as indicated by the Stochastic RSI overbought condition. However, the pair still appears to be finding it difficult to move upside, suggesting a slight pullback as the lines of the momentum oscillator appear bent to the south.
To this end, the actions of the pair on the shorter timeframe suggest an impending move above $0.6671 may materialize. However, the stochastic oscillator on this timeframe signals there might be a temporary halt in the move to the north.
You can purchase crypto coins here. Buy Crypto