Bitcoin (BTC) Price Prediction: BTC/USDT Retains Vulnerability
Estimated Reading Time: 3 minutes
Don’t invest unless you’re prepared to lose all the money you invest. This is a high-risk investment and you are unlikely to be protected if something goes wrong. Take 2 minutes to learn more

Date: November 12, 2025
The Bitcoin market has suffered significant setbacks after its price action spiraled downward upon testing the $125,000 price level. While the ongoing session shows some resistance to further downward correction, the market remains in bearish territory.
BTC/USDT Long-Term Trend — Bearish (Daily Chart)
Key Price Levels
Resistance: $105,000, $110,000, $115,000
Support: $100,000, $97,500, $95,000
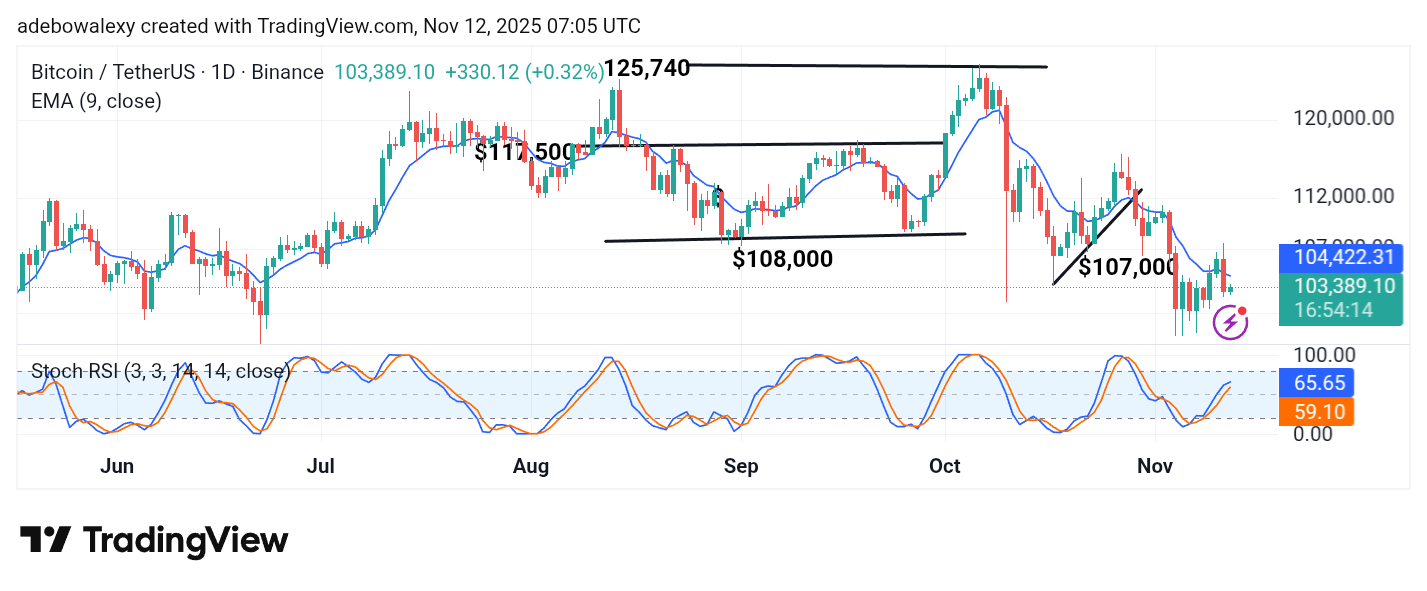
Price action on the Bitcoin daily chart revealed a strong downward correction in the previous session. As a result, the price fell notably below the 9-day Exponential Moving Average (EMA) curve. The latest price candle appears green but remains positioned beneath the 9-day EMA. Nevertheless, the lines of the Stochastic Relative Strength Index (SRSI) indicator continue to show a generally upward trajectory despite the visible deflection on the lead line.
Bitcoin Price Prediction: BTC/USDT Maintains Short-Term Upward Bias Despite Vulnerabilities
The Bitcoin market recently rebounded upward off the $100,000 support level. Although the recovery has been somewhat irregular, there are signs suggesting that bullish forces are striving to sustain the ongoing rebound. The latest price candle on the chart is relatively small, and its position below the 9-day EMA curve indicates that upward momentum remains weak.
Additionally, the SRSI indicator lines are trending upward but appear overextended for the modest short-term movement seen in the market. The deflection on the SRSI’s lead line suggests that the current price recovery remains fragile and susceptible to further downward pressure.
Bitcoin Price Prediction: BTC/USDT’s Gradual Recovery Remains Weak (4-Hour Chart)
As of the time of writing, the BTC market has recorded two consecutive green sessions. However, the latest price candle appears smaller than the previous one, and price action remains below the 9-day EMA curve.
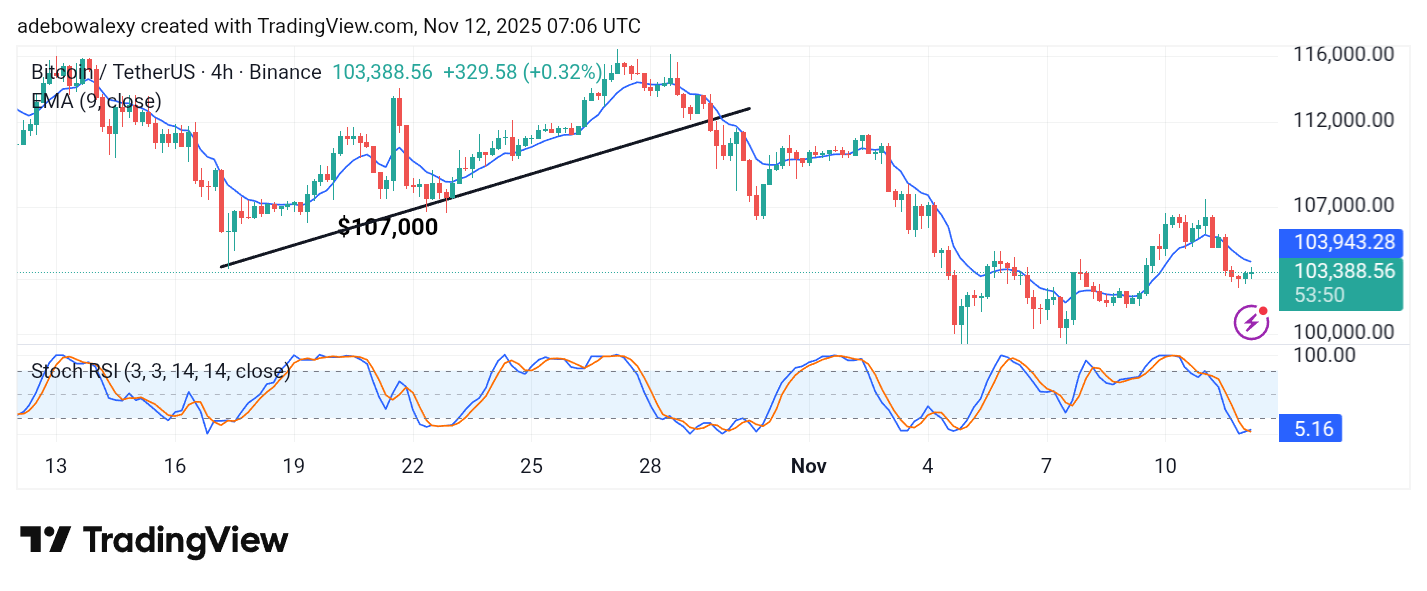
The SRSI indicator has produced an upside crossover, but the ensuing lines continue to move sideways at the time of writing.
This implies that the market still requires stronger bullish momentum to push past the 9-day EMA curve. A breakout above this level could reinforce bullish sentiment and drive prices higher. Therefore, traders may set a short-term target around the $105,000 price level.