Bitcoin Price Prediction: BTC/USDT Breaches a Three-Month-Old Support Level
Estimated Reading Time: 3 minutes
Don’t invest unless you’re prepared to lose all the money you invest. This is a high-risk investment and you are unlikely to be protected if something goes wrong. Take 2 minutes to learn more

Bitcoin Price Prediction (February 25)
The bearish momentum in the Bitcoin market has strengthened. As a result, price action has broken the support at the $92,000 mark. The longer-term outlook appears vulnerable; however, the market is experiencing a short-term pullback. Let’s take a more thoughtful look at the market.
BTC/USDT Long-Term Trend: Bearish (Daily Chart)
Key Price Levels:
Resistance: $90,000, $95,000, $100,000
Support: $85,000, $80,000, $75,000
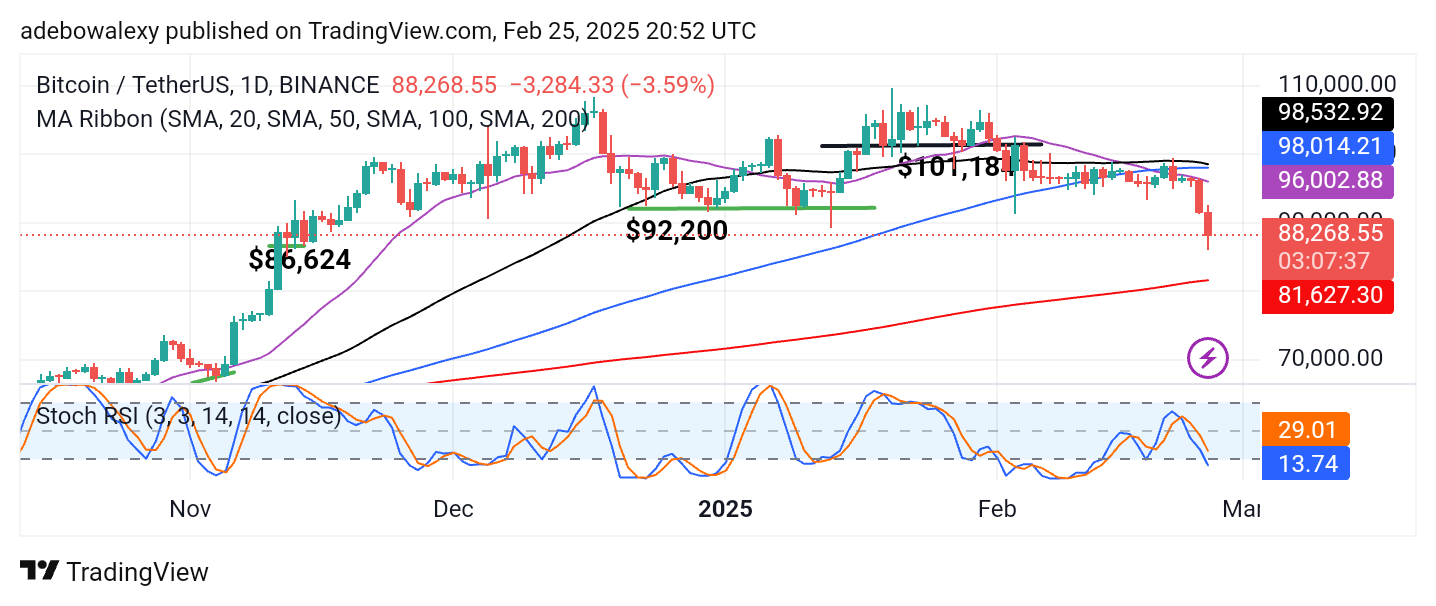
On the daily chart, price action has fallen more vigorously since the previous session. Additionally, the ongoing session has seen a significant further decline. However, the most recent price candle appears to be contracting, hinting at a possible pullback in the market.
Despite this, Bitcoin remains below the 20-, 50-, and 100-day Moving Average (MA) lines. Yet, price action still holds above the 200-day MA curve.
Bitcoin Price Prediction: BTC/USDT Sees a Surge in Bearish Activity
Price action in the Bitcoin market has fallen sharply between the previous session and the ongoing session. As a result, price action has dropped to a level last tested three months ago. Bitcoin has now fallen below most of the MA lines on this chart.
However, the latest price candle suggests some buying activity in the session, as indicated by the lower shadow, revealing the presence of upward forces. Nevertheless, price action remains subdued and may still be considerably vulnerable.
Bitcoin Price Prediction: BTC/USDT Upward Rebound Still Under Pressure (4-Hour Chart)
As suspected, the Bitcoin market has been experiencing a minimal recovery in the shorter time frame. On the 4-hour chart, the market has been rising since the previous session. However, the latest price candle appears more compressed than the previous ones.
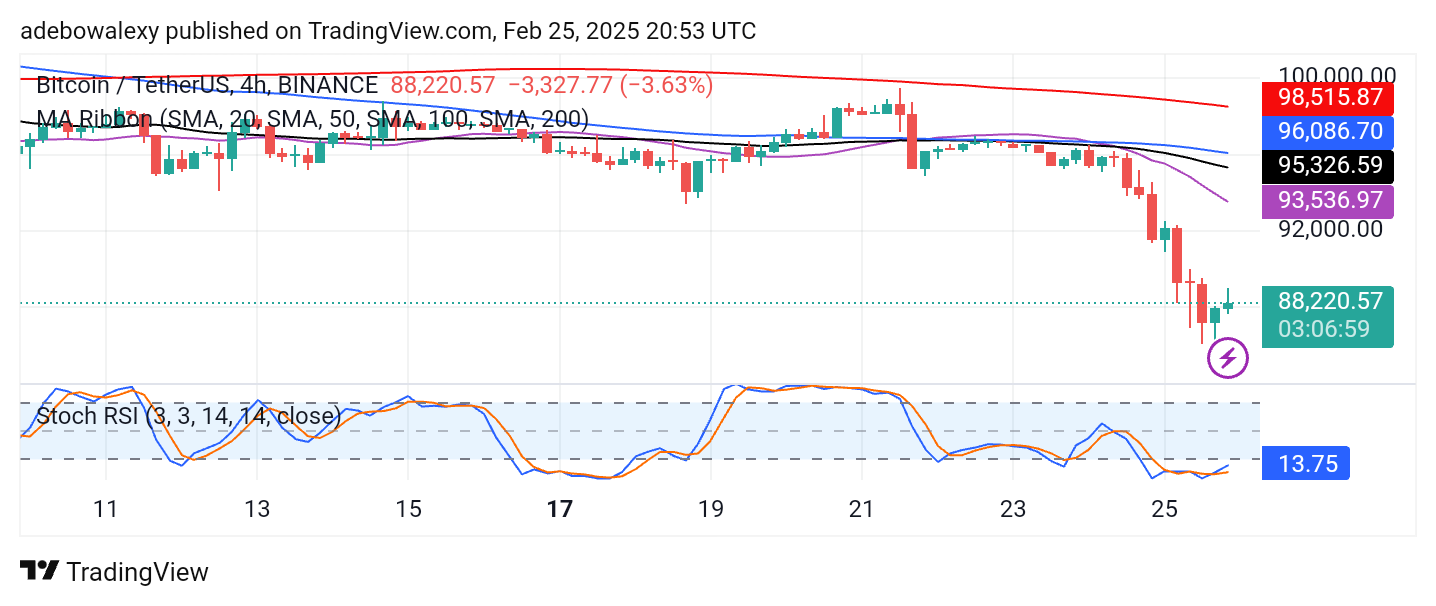
Despite this, trading activity remains below all the MA lines on the chart. Additionally, the Stochastic RSI lines have delivered an upside crossover in the oversold region, but the movement appears sharp.
Technical indicators suggest that the market remains highly vulnerable, making it prone to further downward retracements. Even though the current session is still green, the appearance of the corresponding price candle suggests that downward forces are still influencing price movement. Therefore, traders can anticipate a potential retracement toward the $85,000 mark unless contrary fundamentals emerge.

