Litecoin Price Prediction: LTC/USDT Continues to Oscillate Above the $120 Price Level
Estimated Reading Time: 3 minutes
Don’t invest unless you’re prepared to lose all the money you invest. This is a high-risk investment and you are unlikely to be protected if something goes wrong. Take 2 minutes to learn more

Litecoin Price Prediction (February 24)
The general crypto market has been largely oscillating due to instability in the BTC market. This has also been reflected in the Litecoin market, with price action suggesting that the market may have found strong support above key technical landmarks.
LTC/USDT Long-Term Trend: Bearish (Daily Chart)
Key Price Levels:
Resistance: $130.00, $140.00, $150.00
Support: $120.00, $110.00, $100.00
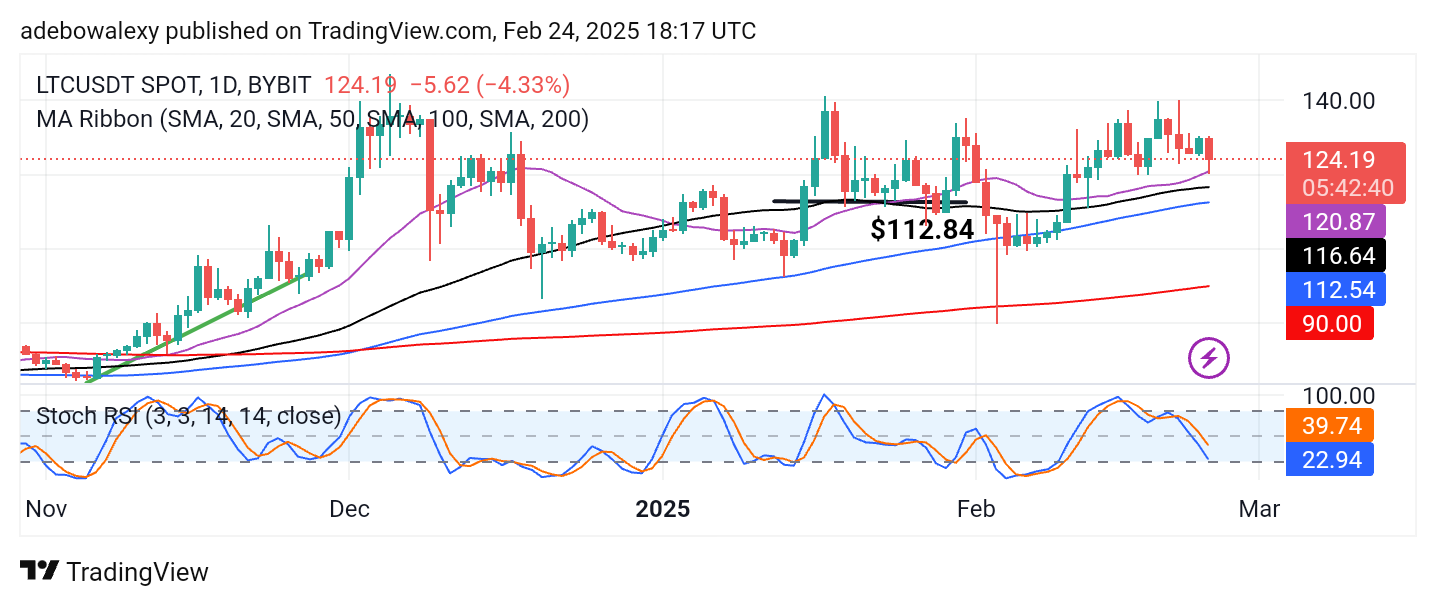
Litecoin’s price activity appears to be stabilizing above the $120 mark, as observed in previous and recent trading sessions. Although the last price candle has shown a notable decline, the token’s price remains above all Moving Average (MA) lines. Consequently, at the time of writing, the token is trading at a price level of $124.19. Meanwhile, the lines of the Stochastic Relative Strength Index (RSI) are still steadily declining into the oversold zone, indicating a potential reversal.
Litecoin Price Prediction: Upside Forces Are Lurking in the LTC/USDT Market
Price action in the Litecoin market continues to sustain itself above important technical levels. The fact that volatility has not caused the market to drop below the 20-day MA line or the $120 price level suggests that price action has established a strong baseline.
Downward forces have prevailed but failed to trigger a significant setback in this market. The last price candle on the chart has a lower shadow, suggesting that upside forces are beginning to take effect. Meanwhile, the Stochastic RSI does not yet reflect the perceived bullish momentum in the current session. Nevertheless, traders can remain optimistic, as the market may still move upward.
Litecoin Price Prediction: LTC/USDT Rebounds Off Support (4-Hour Chart)
In the LTC/USDT 4-hour chart, price activity has rebounded off the $120 support level. The last price candle on the chart is green, confirming the upward movement observed on the daily chart.
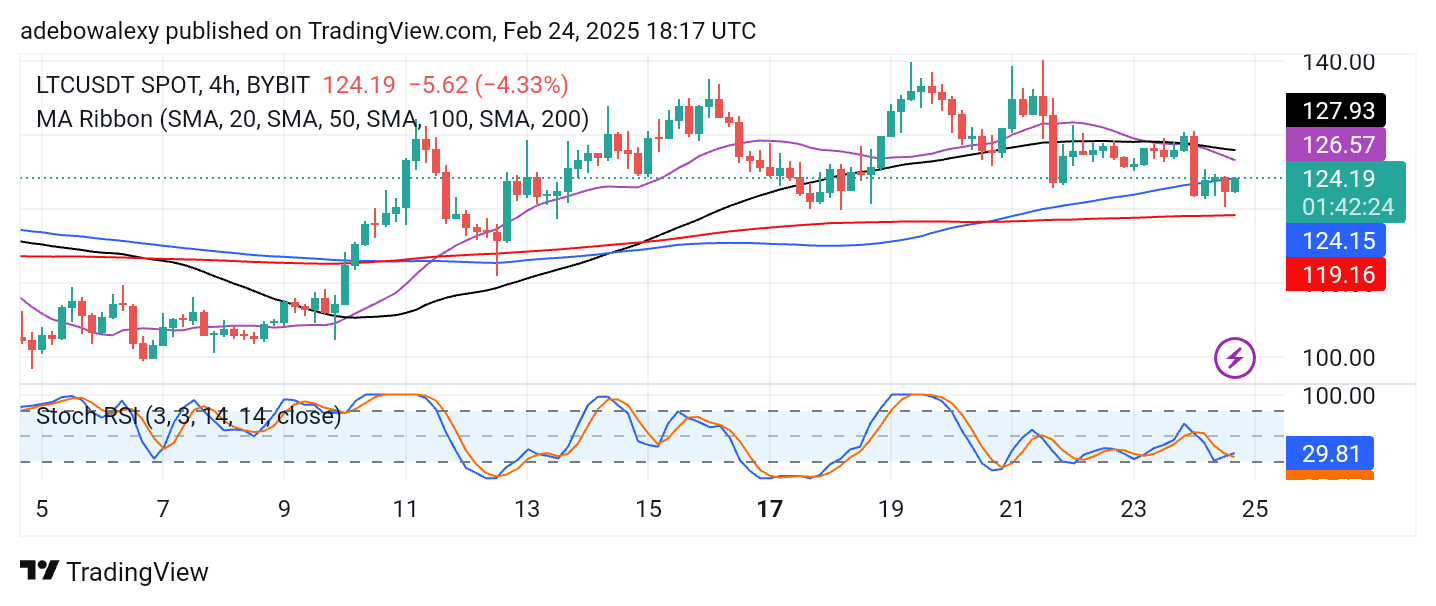
As a result, the token’s current price is now just above the 100-MA curve, supported by the latest price candle. Additionally, an upside crossover can be seen on the Stochastic RSI, indicating the possibility of price action retracing toward higher levels.
Therefore, summing up technical indicators, it seems likely that price activity may move toward the $130 level, with $135 being the next potential target.