Cardano (ADA/USDT) Struggling Under Critical Support as Market Faces Bearish Pressure
Estimated Reading Time: 3 minutes
Don’t invest unless you’re prepared to lose all the money you invest. This is a high-risk investment and you are unlikely to be protected if something goes wrong. Take 2 minutes to learn more
Cardano against Tether has dropped 8.06% in the past 24 hours, performing worse than the broader crypto market, which fell 6.15%. This decline was largely driven by a selloff in the market, as Bitcoin’s price dropped below $100,000, leading to losses in altcoins.
Another factor was $869 million pulled out from Bitcoin ETFs, showing that institutional investors are becoming cautious. On top of that, the pair broke through a key support level at $0.54, and fears about rising interest rates are affecting riskier assets like cryptocurrencies.
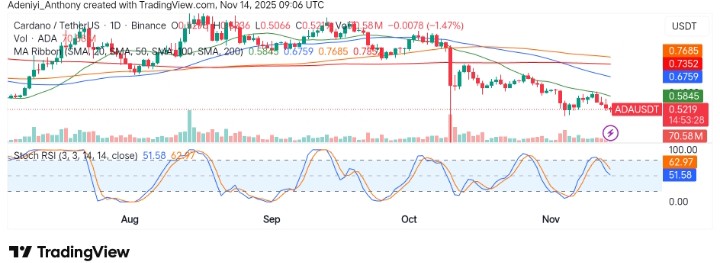
As it stands, technical indicators on the daily timeframe are suggesting a further dip in value, as bearish momentum drives the price to $0.5219 below the multiple moving averages.
Technical Indicators
Major Resistance Levels: $0.5601, $0.5877, and $0.6159
Major Support Levels: $0.5000, $0.4500, and $0.4000
Technical Analysis
Technically, Cardano against Tether has really been facing strong sell-offs in recent times, and at the moment, it appears the pair is drifting further into the $0.4 zone. The price at the present time is trading below the cluster of the moving average ribbon as the Stochastic RSI heads to south.
To this end, for a bullish reversal to materialize, a break above $0.5601 must be recorded; otherwise, the pair’s strong defense around $0.5000 may be breached.
Is Cardano Really Preparing for the Next Move?
Cardano in the recent move seems to be facing bearish pressure since the 13th of Oct, failing to maintain an upside trajectory and breaking below a critical support level. This action, in some ways, has reduced the probability of an upside move in the coming session, but it doesn’t mean there won’t be one in subsequent sessions. As it stands, micro resistance may pose a minor hindrance to any potential upward movement.
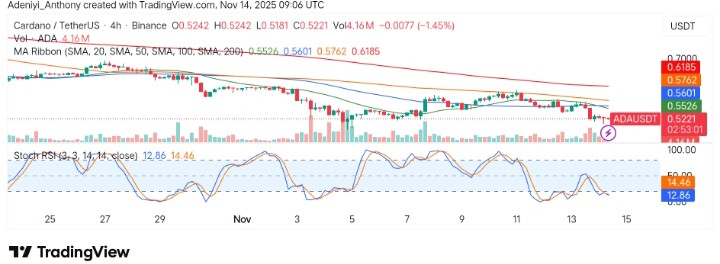
ADA/USDT Analysis: Will the $0.500 Support Hold?
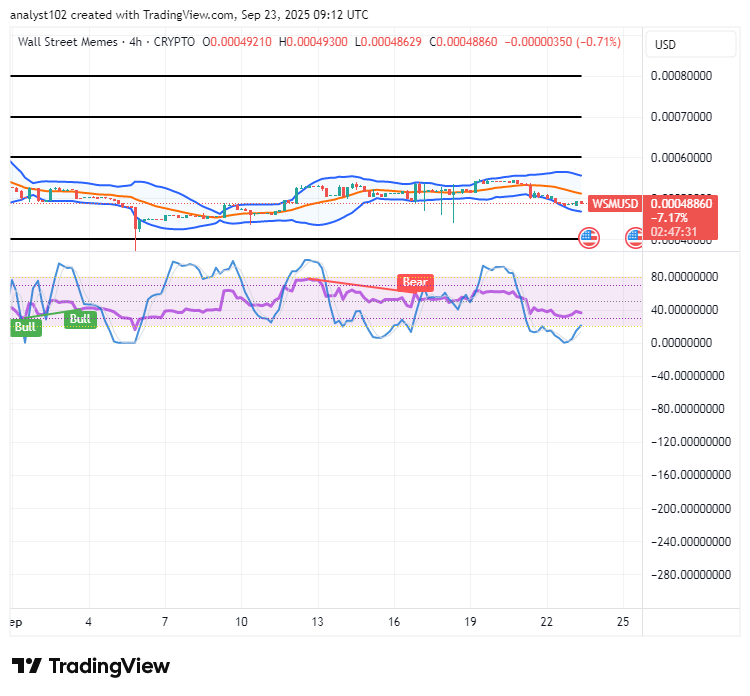
On the 4-hour chart, ADA/USDT appears to be exhibiting a similar pattern, trading under the multiple moving average lines as the price extends further to the south. However, the Stochastic RSI signals a potential reversal might be on the way, judging from the slightly curved lines around the oversold region.
To this end, ADA seems to be planning a comeback to the north on a shorter timeframe, but a move above $0.5300 is still necessary to confirm this action.
You can purchase crypto coins here. Buy Crypto