BNB’s Price Trades Slightly as It Moves below the $340 Peak
Estimated Reading Time: 2 minutes
Don’t invest unless you’re prepared to lose all the money you invest. This is a high-risk investment and you are unlikely to be protected if something goes wrong. Take 2 minutes to learn more

BNB (BNB) Long-Term Analysis: Bullish
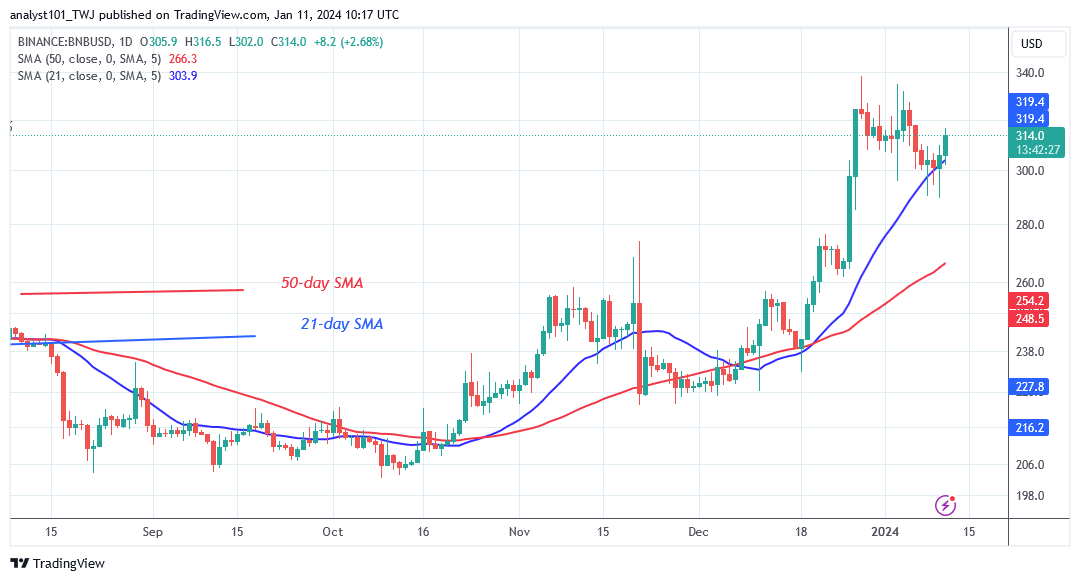
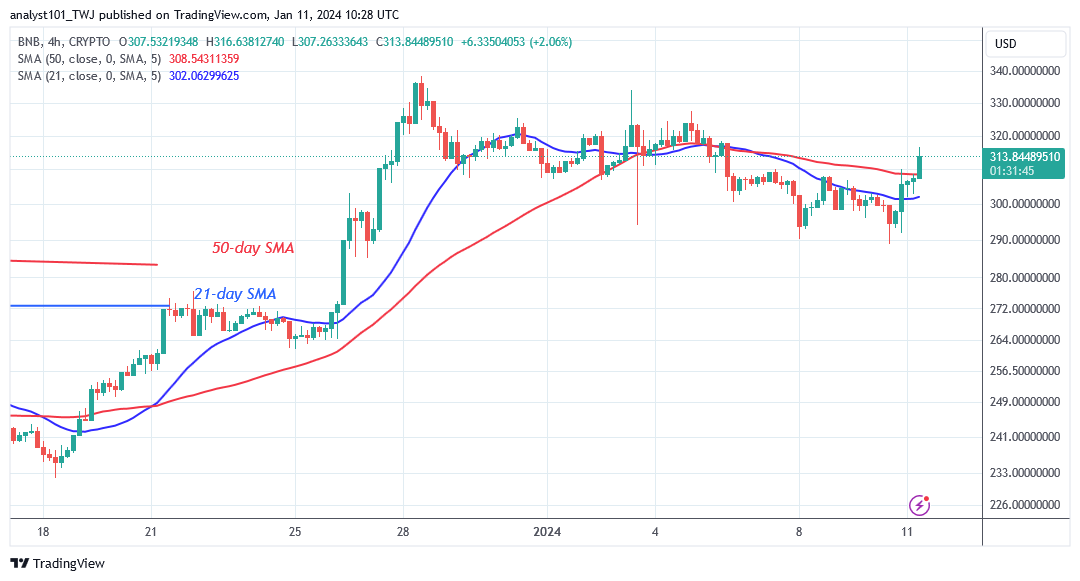
The price of BNB has returned above the 21-day moving average as it moves below the $340 peak. The cryptocurrency asset is retreating after the rally that ended on December 28. The altcoin’s price has been slowly rising above the $300 support level and the 21-day SMA. The delayed price movement can be attributed to the Doji candlesticks.
The $340 resistance zone has halted all upward movements. In addition, the wicks of the long candlestick show that there is significant selling pressure at the $340 resistance level. The dangers lie with BNB decrease if the bears breach below the 21-day SMA. The current value of BNB/USD is $310.70 as of this writing.
Technical indicators:
Major Resistance Levels – $440, $460, $480
Major Support Levels – $240, $220, $200
BNB (BNB) Indicator Analysis
On both charts, the price bars of BNB are above the lines representing the moving average. The value of the altcoin will typically rise as long as the price bars are above the moving average lines. Nevertheless, as BNB consolidates above the 21-day SMA support, the upward movements have been restricted. Doji candlesticks, which restrict price movement, dominate BNB price action.
What Is the Next Direction for BNB (BNB)?
BNB/USD trades between the 21-day SMA and the $340 high but moves below the $340 peak. The altcoin’s price has gradually changed, although it still moves within a range above the moving average lines.
You can purchase crypto coins here. Buy LBLOCK
Note: Cryptosignals.org is not a financial advisor. Do your research before investing your funds in any financial asset or presented product or event. We are not responsible for your investing results