Dogecoin (DOGE) Price Prediction: DOGE/USDT Approaches the $0.2000 Level
Estimated Reading Time: 3 minutes
Don’t invest unless you’re prepared to lose all the money you invest. This is a high-risk investment and you are unlikely to be protected if something goes wrong. Take 2 minutes to learn more

Dogecoin Price Prediction: April 28, 2025
Price action in the Dogecoin market has started showing some bright sparks. The market notably came back to life six sessions ago. Since then, price activity has managed to stay afloat, thereby increasing the market’s chances of climbing further upwards.
DOGE/USDT Long-Term Trend: Bullish (Daily Chart)
Key Price Levels:
Resistance: $0.2000, $0.2250, $0.2500
Support: $0.1800, $0.1750, $0.1500
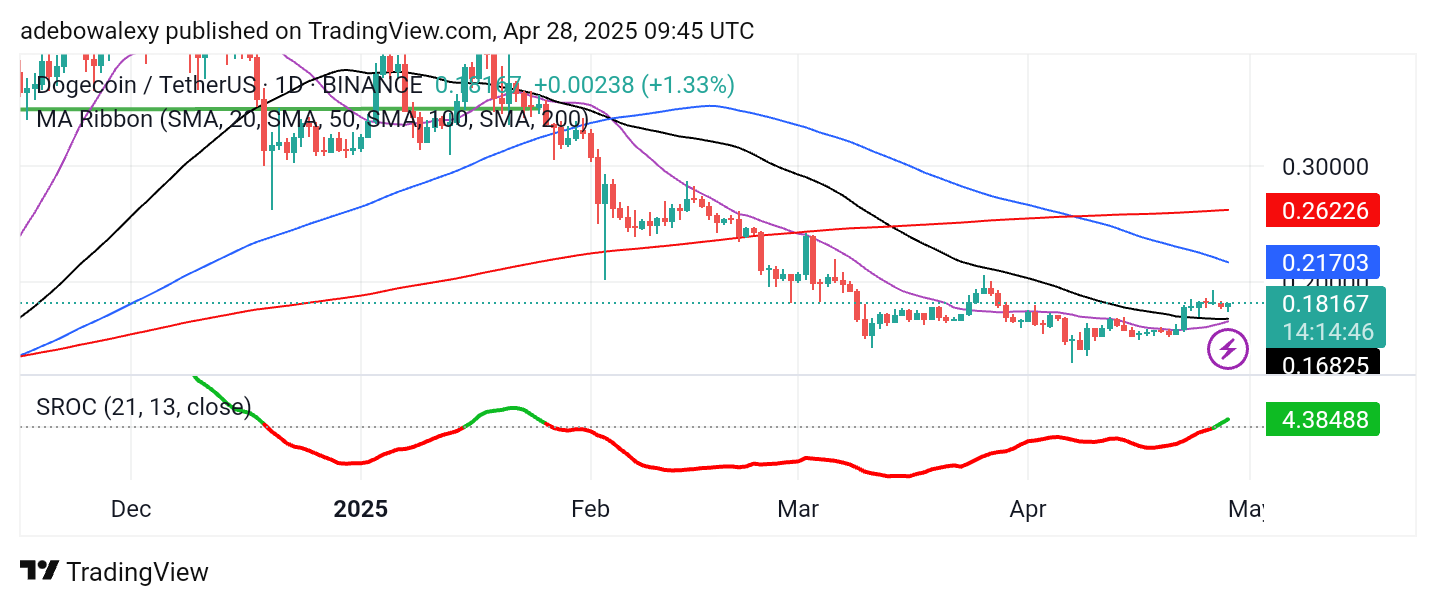
The last price candle on the Dogecoin daily chart is a green one. It has appeared directly above the converging 20- and 50-day Moving Average (MA) lines. Simultaneously, the Stochastic Rate of Change (SROC) indicator line has continued on its upward path. Currently, the latter part of the SROC indicator line is above the equilibrium level and now appears green, suggesting continued bullish momentum.
Dogecoin (DOGE) Price Prediction: DOGE/USDT May Pick Up More Bullish Momentum
The ongoing session in the Dogecoin daily market appears bullish. Interestingly, this development has occurred above the 20- and 50-day MA lines. Although the market has been consolidating sideways for a while now, it has stayed above these MA lines.
Be that as it may, the convergence of the 20- and 50-day MA lines at this point signals a growing possibility of stronger bullish momentum. Meanwhile, the SROC lines can be seen rising past the equilibrium level, and the terminal end of the indicator line is green, suggesting growing bullish activity in the market.
Dogecoin Price Prediction: DOGE/USDT Maintains a Promising Stand
Price activity in the Dogecoin 4-hour market session continues to maintain positivity, aligning with indications from the daily chart. Price action has stayed in the green, maintaining an upward path since the previous session. As a result, the last green price candle has pushed through the 20-day MA line, which is the highest MA line on this chart.
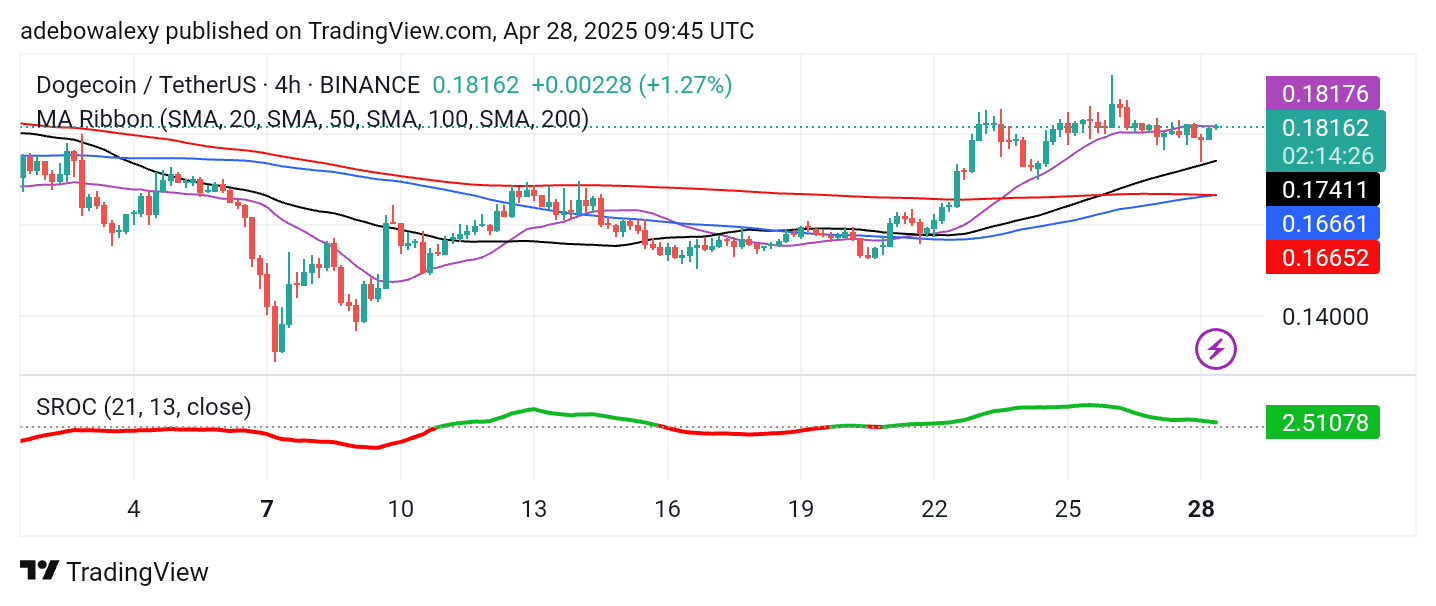
Additionally, the 100- and 200-day MA lines are converging for a crossover below price activity. At the same time, the SROC indicator lines are situated above the equilibrium level but currently have a sideways trajectory. Nevertheless, price activity in this market has a strong chance of closing in on the $0.2000 price mark.