Dogecoin (DOGE) Price Prediction: DOGE/USDT Succumbs to Gravity
Estimated Reading Time: 3 minutes
Don’t invest unless you’re prepared to lose all the money you invest. This is a high-risk investment and you are unlikely to be protected if something goes wrong. Take 2 minutes to learn more

Dogecoin (DOGE) Price Prediction (January 27):
Price action in the Dogecoin market has finally succumbed to headwinds, leading to a decline below the support at the $0.3500 price level. Downward forces appear fairly strong in this session, threatening further price declines.
DOGE/USDT Long-Term Trend: Bearish (Daily Chart)
Key Price Levels:
Resistance: $0.3500, $0.4000, $0.4500
Support: $0.3000, $0.2500, $0.2000
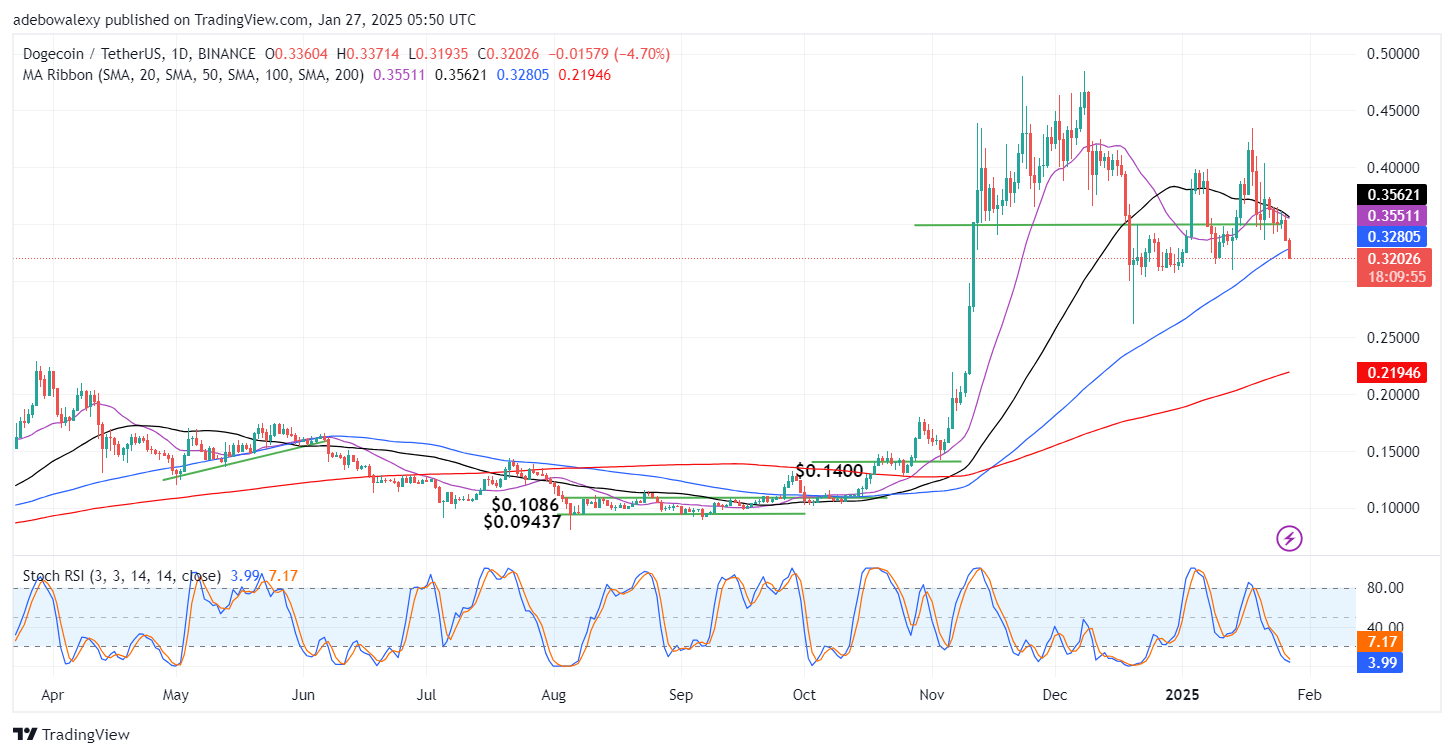
Dogecoin had been trading above the psychological support level of $0.3500 for nearly two weeks. However, volatility rapidly diminished, and the convergence of the 20- and 50-day Moving Average (MA) lines initiated downward momentum in the market. This has pushed the price to levels last seen about 18 sessions ago. Consequently, the most recent price candle now lies below the 20-, 50-, and 100-day MA curves. Meanwhile, the Stochastic Relative Strength Index (RSI) continues to descend into the oversold region, further confirming bearish momentum.
Dogecoin (DOGE) Price Prediction: DOGE Likely to See Further Declines
The appearance of the last two price candles on the chart suggests considerable bearish strength. These candles are of moderate size, lack upper and lower shadows, and indicate rapid market declines.
Price action now lies below three out of four major MA lines, exposing the market to additional headwinds. Additionally, the trajectory of the RSI indicator lines remains bearish. As such, traders can anticipate that price action may continue to decline, with all current indicators supporting further reductions.
Dogecoin (DOGE) Price Prediction: Bears Target $0.3000 Baseline (4-Hour Chart)
On the 4-hour chart, Dogecoin price action reflects intensifying headwinds. The 20-, 50-, 100-, and 200-day MA lines are all converging above the current price action, confirming a strong downtrend. The Stochastic RSI lines are also plunging sharply into the oversold region, signaling sustained bearish pressure.
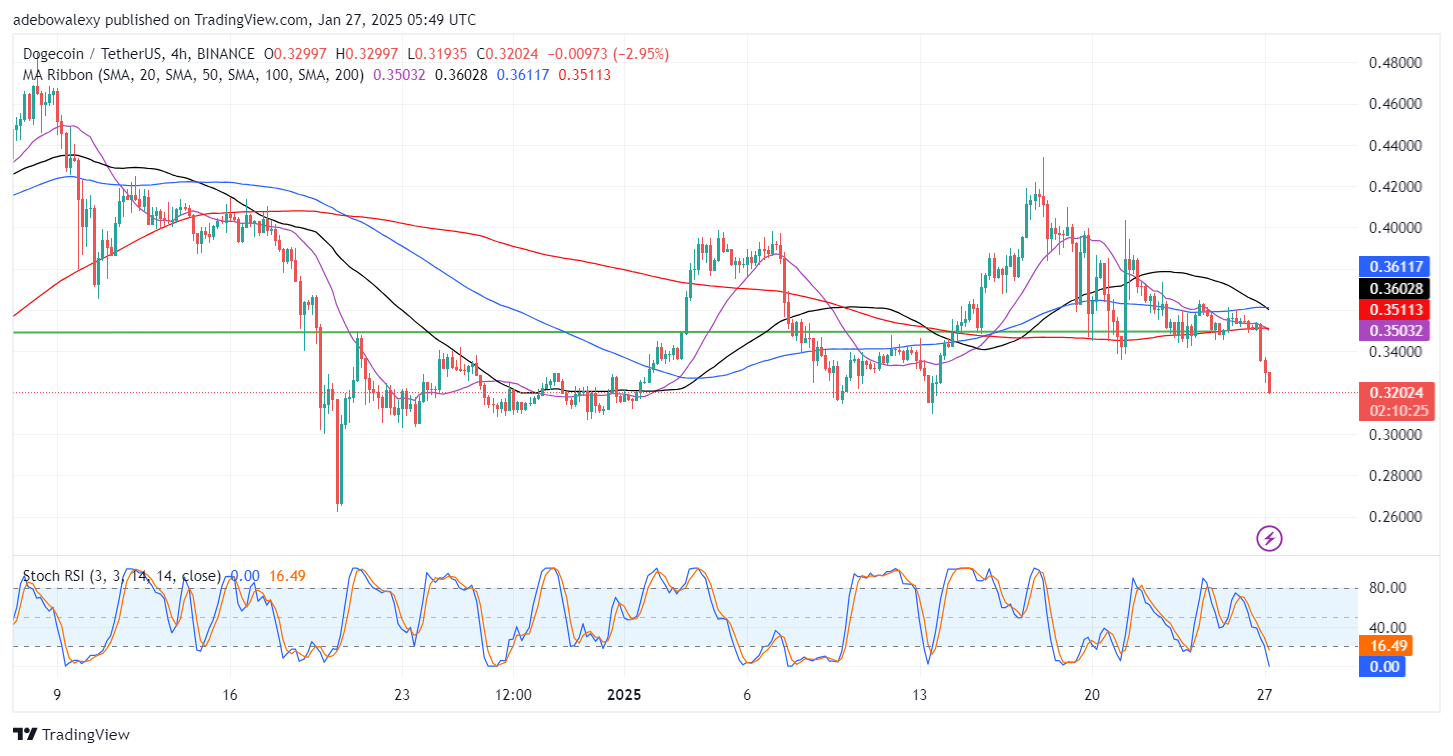
Indicators in this market strongly suggest further price declines. The convergence of the MA lines and the bearish trajectory of the RSI indicator reinforce this outlook. The most recent price candle lacks shadows, indicating that bears are in firm control of price movement. As a result, the market is likely to soon test the $0.3200 price level.