EIGEN (EIGEN/USDT) Faces Renewed Selling Pressure as Short-Term Momentum Weakens
Estimated Reading Time: 3 minutes
Don’t invest unless you’re prepared to lose all the money you invest. This is a high-risk investment and you are unlikely to be protected if something goes wrong. Take 2 minutes to learn more

The market for the EigenLayer and Tether trading pair is showing renewed signs of bearish pressure after failing to hold above short-term support. However, the overall sentiment has shifted from optimism in early June to caution as selling volume increases.
To this end, the price has now dropped below the Guppy Multiple Moving Averages (GMMA), signaling a weakening trend structure. Also, the Stochastic RSI recently crossed downward from overbought levels, confirming a further deepening.
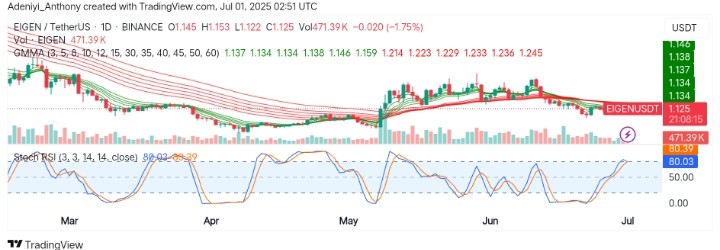
Currently, EigenLayer trades at $1.125 with over 471k traded volumes for the day.
Technical Indicators
Major Resistance Levels: $1.138, $1.159, and $1.214
Major Support Levels: $1.122, $1.100, and $1.065
EIGEN Technical Analysis
Technically, the overall daily trend of EigenLayer against the Tether remains sideways to bearish, with lower highs forming since mid-June. However, the price is currently below all GMMA layers, suggesting that the scalpers and investors are not supportive of an uptrend at this stage.
From another angle, the Stochastic RSI shows the blue and orange lines have crossed downward above the 80 level, giving a strong bearish signal as the volume indicates more downward pressure is on the horizon.
To this end, a move below $1.120 with increasing volumes would confirm a further downtrend, while a close at $1.138 would suggest stability in the market.
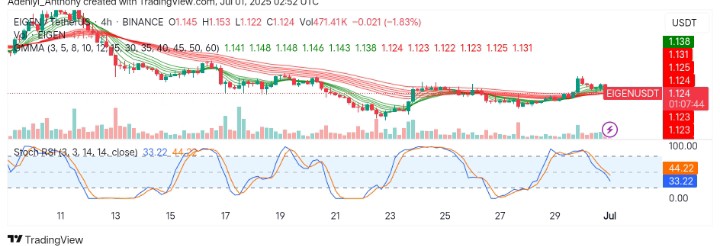
EIGEN/USDT Analysis: A Continued Sideways Movement or Downtrend?
On the 4H chart, EIGEN/USDT is trading below all GMMA clusters again, signaling a fresh downside continuation after a failed bullish attempt. However, the recent upward move above $1.130 was rejected, forming a lower high.
Additionally, bearish traders seem to have returned with higher volume, suggesting seller’s dominance, as the Stochastic RSI heads downward from mid-zones (44.22 to 33.22).
To this end, the pair’s price action shows increasing chances of retesting $1.122 or breaking it to target $1.10 next.
You can purchase crypto coins here. Buy LBlock