Eigenlayer (EIGEN/USDT) Faces Downward Pressure: Will the Downtrend Continue?
Estimated Reading Time: 3 minutes
Don’t invest unless you’re prepared to lose all the money you invest. This is a high-risk investment and you are unlikely to be protected if something goes wrong. Take 2 minutes to learn more

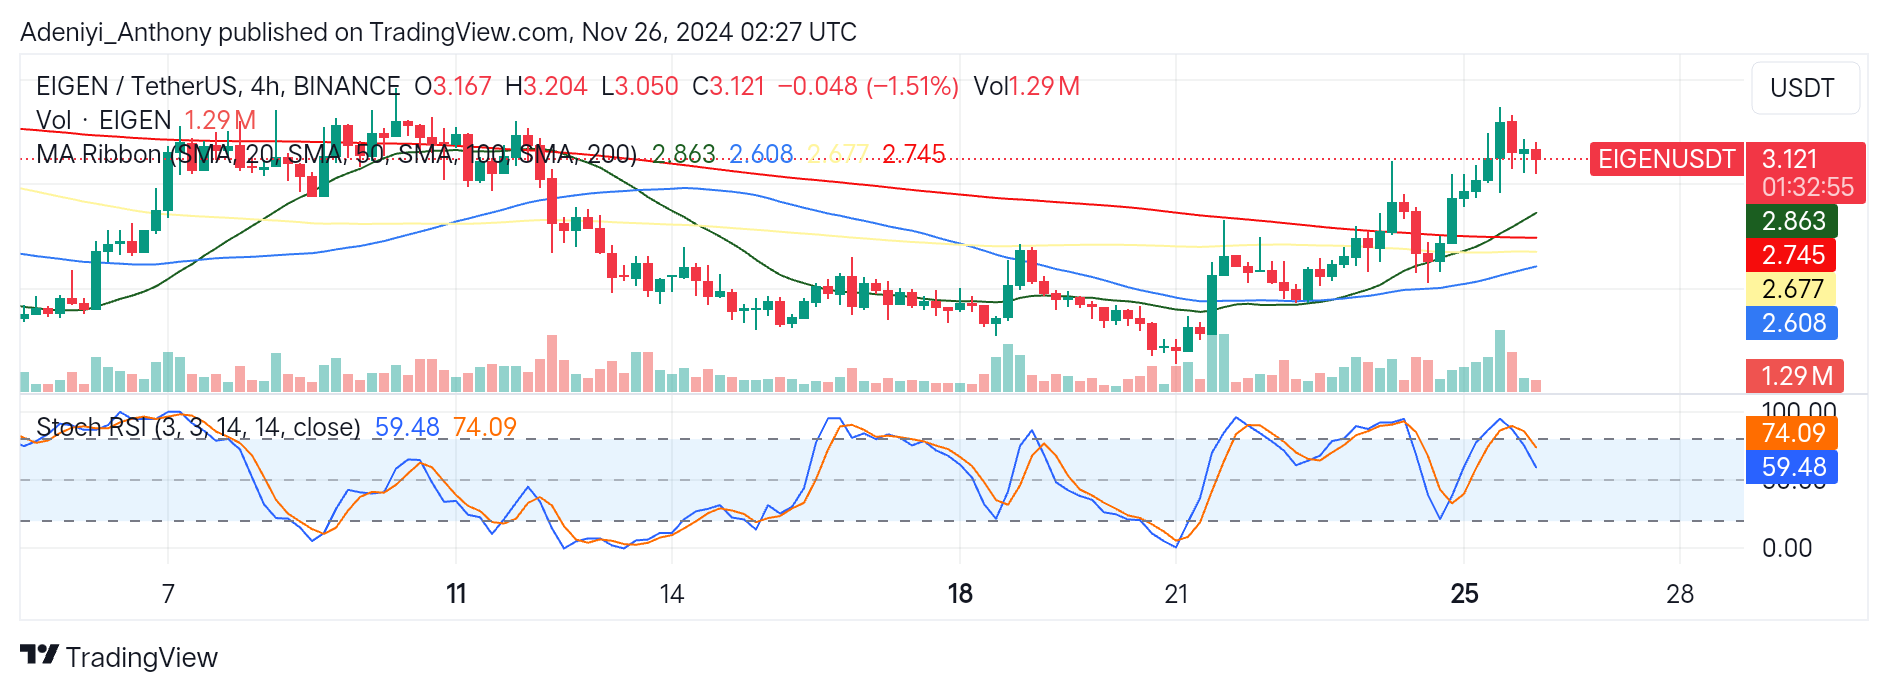
In recent times, the Eigenlyer against the Tether on a 4-hour timeframe has experienced a minor price surge to the North, as seen with the formation of previous higher highs and lows. However, the current price actions suggest the pair is facing strong selling pressure while approaching the $3.5000 level, as the price seeks to retrace to the immediate support at $2.863.
Currently, Eigenlayer trades at $3.121 with a volume of 1.29 million, representing 1.51% below the recent trading session.
Technical Indicators
Major Resistance Levels: $3.124, $3.241, and $3.341
Major Support Levels: $2.863, $2.745, and $2.608
EigenLayer Technical Analysis
Eigenlayer’s analysis shows that the coin against Tether is currently on a downtrend. All indicators point to a further downtrend due to the increasing take-profit activities around the $3.500 level.
The positioning of the moving average ribbon shows that the pair was scaling up initially before facing a strong resistance level. Now, as the price seeks the 20-period moving average for support, a break below this level could lead to further decline. Conversely, the pair would see another uptrend provided the bulls are ready to buy the dip at $2.863.
On the other hand, the Stochastic RSI points to the South, suggesting the pair lacks any form of bullish pressure as the lines read 74.09 and 59.48. However, traders should watch the immediate support level for a potential re-entry point.
EIGEN/USDT Analysis: A correction or Further Downtrend?
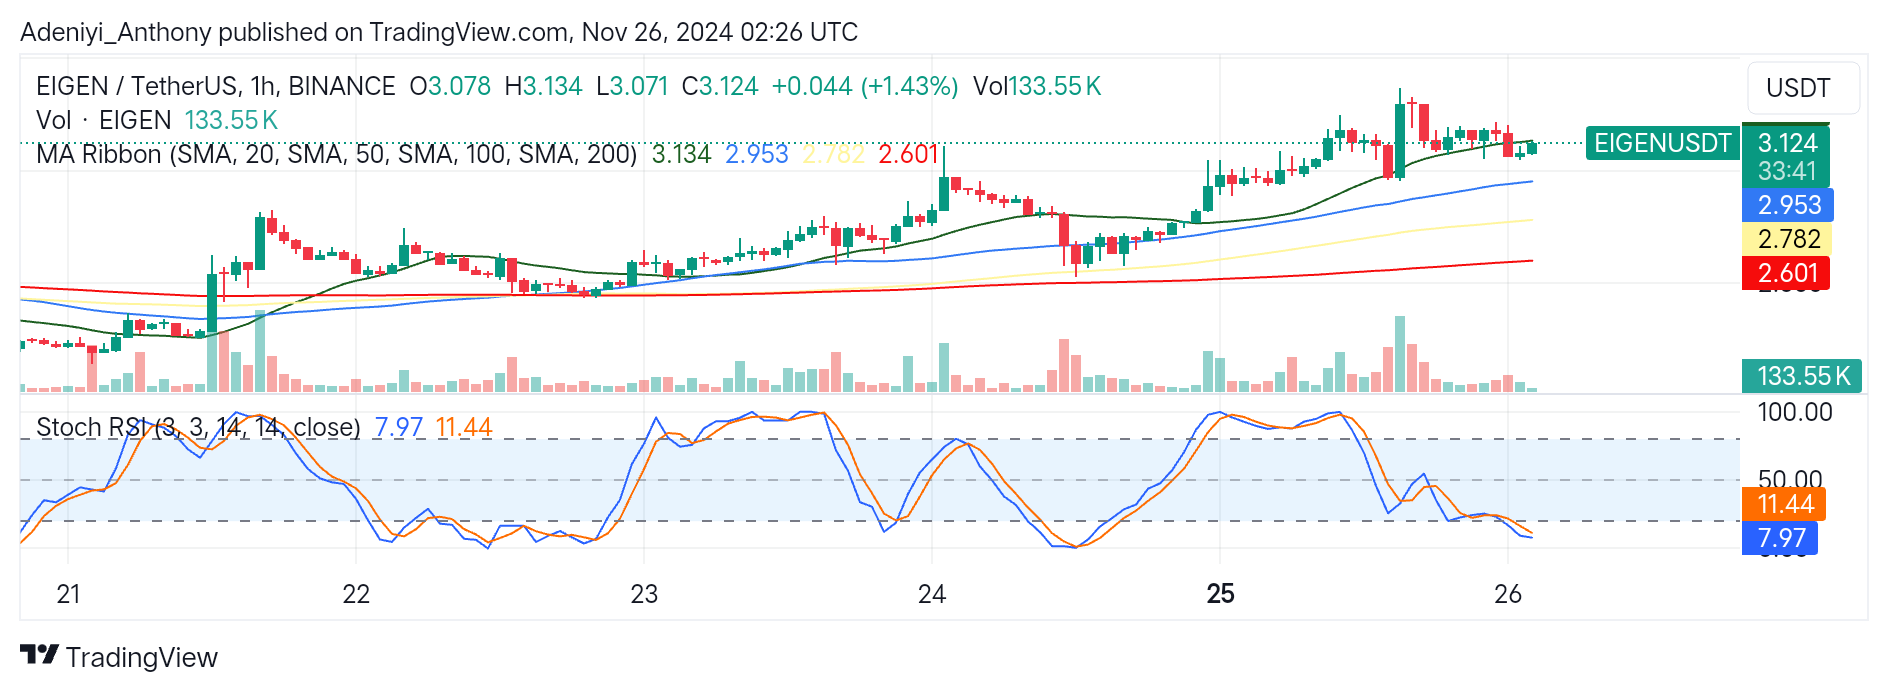
On the daily timeframe, the analysis of Eigen against the Tether shows the pair is ranging around the 20-period line, which suggests a lack of traders’ interest. However, the current bullish uptick suggests the pair is about to rally up as the price climbs from $3.071 to $3.124, denoting a 1.43% gain despite the recent price dip.
From the bottom side of the chart, the Stochastic RSI reads 11.44 and 7.97, respectively; this indicates the pair is oversold and may be due for a correction in the near term. To this end, a break above the 20-period moving average at the $3.134 level with strong buying volume will push the price further up. Traders can enter the market with a close watch on the Stochastic lines crossover.
You can purchase crypto coins here. Buy LBlock