Ethereum (ETH/USDT) Faces Key Support as Momentum Slows: Will a Trend Reversal Occur?
Estimated Reading Time: 4 minutes
Don’t invest unless you’re prepared to lose all the money you invest. This is a high-risk investment and you are unlikely to be protected if something goes wrong. Take 2 minutes to learn more
Ethereum Short-term Analysis: Bullish
The market for Ethereum against Tether presents an intriguing scenario, mixed with strong momentum but a possible slowdown in the short term. ETH seems to be encountering some resistance around $4,400, with price action suggesting potential consolidation or a reversal.
At the moment, the market sentiment appears cautious, with recent candlestick patterns and technical indicators hinting at a growing selling interest. However, the next direction will be determined with time and the prevailing dominating market side.
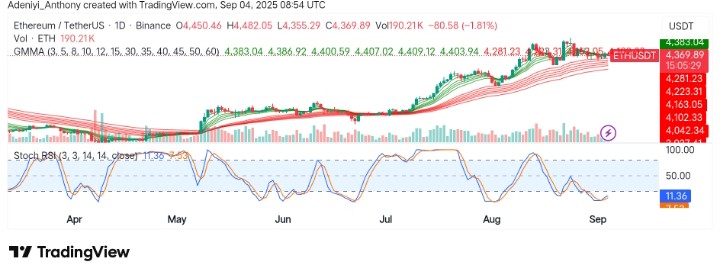
Currently, Ethereum trades at $4,383, recording over 190 thousand traded volumes for the day.
Technical Indicators
Major Resistance Levels: $4,500, $4,650, and $5,000
Major Support Levels: $4,350, $4,250, and $4,100
Ethereum Technical Analysis
For some days, the candlestick formation of Ethereum against Tether appears bearish, suggesting declining bullish momentum around immediate resistance around $4,400 as bearish volume increases. The Guppy Multiple Moving Averages (GMMA) on the chart indicate the bears are in short-term control of the market, as the short-period EMAs align with the long-period set of moving averages.
However, despite the current market situation, the Stochastic RSI suggests the pair may see another move to the north in the near term as the line curls upward from the oversold region. To this end, if the pair fails to hold above $4,350, a move towards $4,100 will be next. However, the $5,000 long-term move is still intact.
Ethereum’s Next Move
Ethereum seems to be riding on an ascending trend line, operating above $4000 with dynamic support around $3,754. On the daily chart, there appears to be a complete pullback action at the current level. However, more bullish momentum is needed to break upside, as one more high still appears likely for the coin.
Ethereum just had its best month ever 🚀
▪️ $135B DEX volume
▪️ $240B+ TVL
▪️ 48M transactions
▪️ 15M active addressesETF inflows were only the start.
Now the chain itself is booming.$ETH new ATH soon? 👀 pic.twitter.com/vJquk2xqME— Crypto King (@CryptoKing4Ever) August 30, 2025
As the market optimism gains more traction, @cryptoking4ever feels optimistic about Ethereum recording another all-time high, leaving a post on X (formerly Twitter) on the previous month’s Ethereum ETF transaction that may likely affect the chain positively.
ETH/USDT Analysis: What to Expect
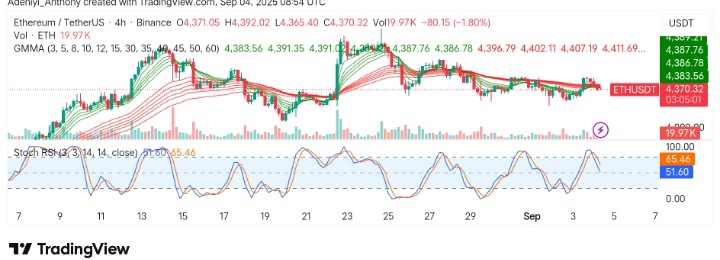
On the 4-hour ETH/USDT chart, the pair has been showing consolidation between the $4,360 and $4,400 levels, as the recent price action indicates no direction in the market. one hand, the Stochastic RSI is at 51.60, indicating dropping momentum as the lines face the south. On the other hand, the GMMA indicator shows the short-term moving averages still above the long-term ones, signaling that upside momentum is still on.
To this end, a breakout above $4,400 could lead to a test of higher levels. However, if the fall in momentum continues, a break below $4,360 will lead to further bearish actions.
You can purchase crypto coins here. Buy Crypto