SPONGE/USD ($SPONGE) Climbs the $0.000097 Support Level
Estimated Reading Time: 3 minutes
Don’t invest unless you’re prepared to lose all the money you invest. This is a high-risk investment and you are unlikely to be protected if something goes wrong. Take 2 minutes to learn more
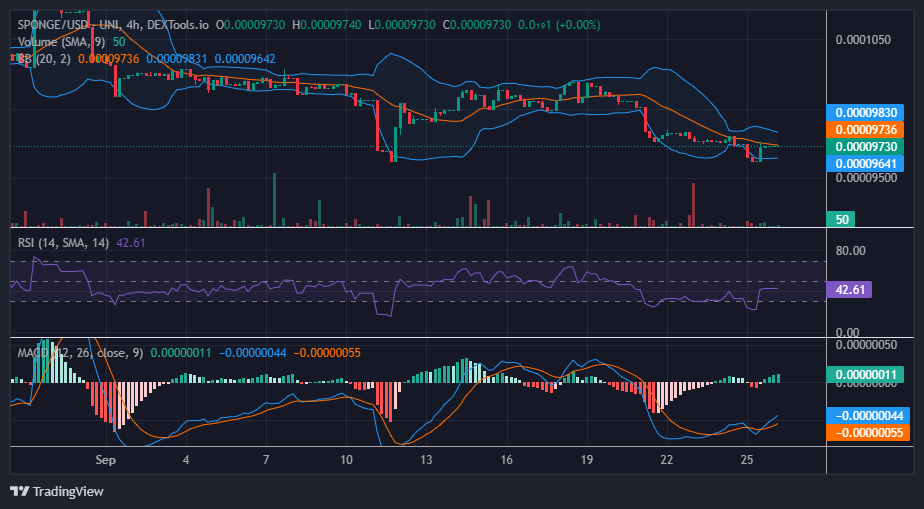
The $SPONGE market experienced a notable rebound subsequent to reaching a pivotal support level at the $0.000096 price point, with prices swiftly recovering. Currently, a degree of price consolidation has brought trading activity back to the $0.000097 level. It is anticipated that the market may embark on an upward rally towards the $0.0001015 price threshold at this juncture. However, the prevailing price movement is presently characterized by a lack of definitive direction as buyers and sellers engage in a standoff, resulting in a relatively stagnant price range around the $0.000097 mark.
Key Levels
- Resistance: $0.000115, $0.000120, and $0.000125.
- Support: $0.000090, $0.000080, and $0.000085.
Sponge (SPONGE/USD) Price Analysis: The Indicators’ Point of View
During the current trading session, the Bollinger Bands indicator is displaying signs of adjusting to a sideways, range-bound market performance. On the other hand, the Moving Average Convergence and Divergence (MACD) indicator’s histograms depict a notable increase in bullish activity, reflecting the widening gap between the MACD line and the Signal line.
Notwithstanding this noteworthy development in the MACD indicator, the actual price action and the Relative Strength Index (RSI) continue to exhibit a lack of clear direction or market indecision. This disparity could potentially signify either an accumulation of momentum for a bullish breakout or a potential reversal. However, in the case of $SPONGE, the circumstances suggest a bullish breakout is more likely, given that this development is occurring in proximity to a support level.
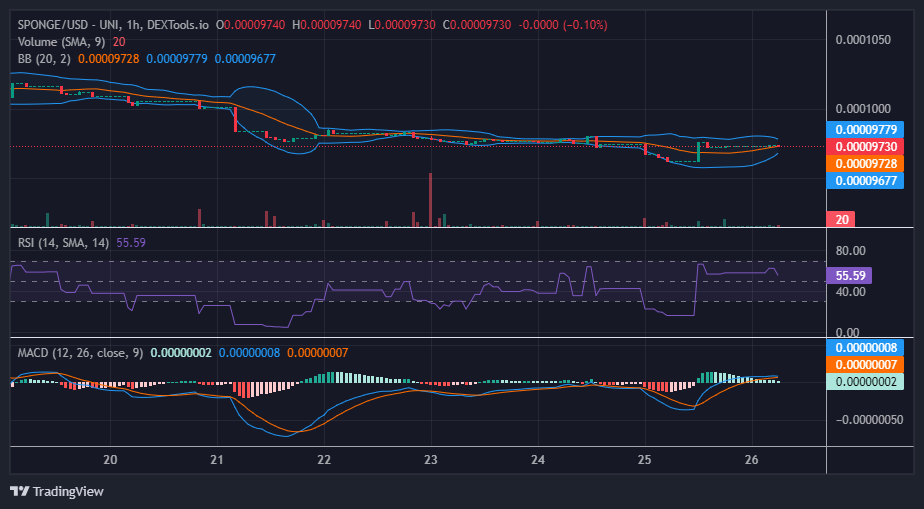
$SPONGE Short-Term Outlook: 1-Hour Chart
From our current market analysis perspective, it is evident that the Bollinger Bands are converging amidst a stagnant market, while the 20-day moving average aligns with the prevailing market activity. This alignment continues to support the indication of an impending upward price surge.
Furthermore, both the Relative Strength Index (RSI) and the Moving Average Convergence and Divergence (MACD) indicators still maintain a bullish stance within the market. Despite the ongoing equilibrium between demand and supply, there is a possibility that bullish sentiment remains dominant.
Traders are advised to exercise vigilance and remain prepared to make informed decisions regarding long position investments.
Delve into trading $SPONGE on @MEXC_Global
🧽 Eager to dive into $SPONGE trading on @MEXC_Global? 🎉
🧽 Ride the tides of this captivating #MemeCoin and surf the #SPONGE wave starting now! 🚀🏄♂️
🔗 https://t.co/idowker7B5 pic.twitter.com/yhWVb2saQj
— $SPONGE (@spongeoneth) September 26, 2023
Invest in the hottest and best meme coin. Buy Sponge ($SPONGE) today!