Is Stellar (XLM) Nearing Exhaustion as It Approaches the Previous Month’s High?
Estimated Reading Time: 3 minutes
Don’t invest unless you’re prepared to lose all the money you invest. This is a high-risk investment and you are unlikely to be protected if something goes wrong. Take 2 minutes to learn more

Summary:
- Stellar (XLM) remains bullish despite the broader market correction.
- Price stays above the 9-day EMA, though momentum indicators suggest overbought conditions.
- Traders are watching for a potential move toward the $0.3000 resistance level.
Following the latest FOMC meeting on June 17, 2026, both the stock and cryptocurrency markets witnessed a negative correction. However, Stellar has continued to move in a positive direction.
The price of the token is now approaching the previous month’s high, although signs of exhaustion appear to be emerging. Nevertheless, the current bullish move cannot be ignored, especially given the broader market correction.
A Look at the Price Chart
The daily chart shows Stellar’s price action rebounding between two key levels. The market recently reached a low that closely aligns with the February bottom. A strong upward rally followed, indicating the establishment of a significant support level.
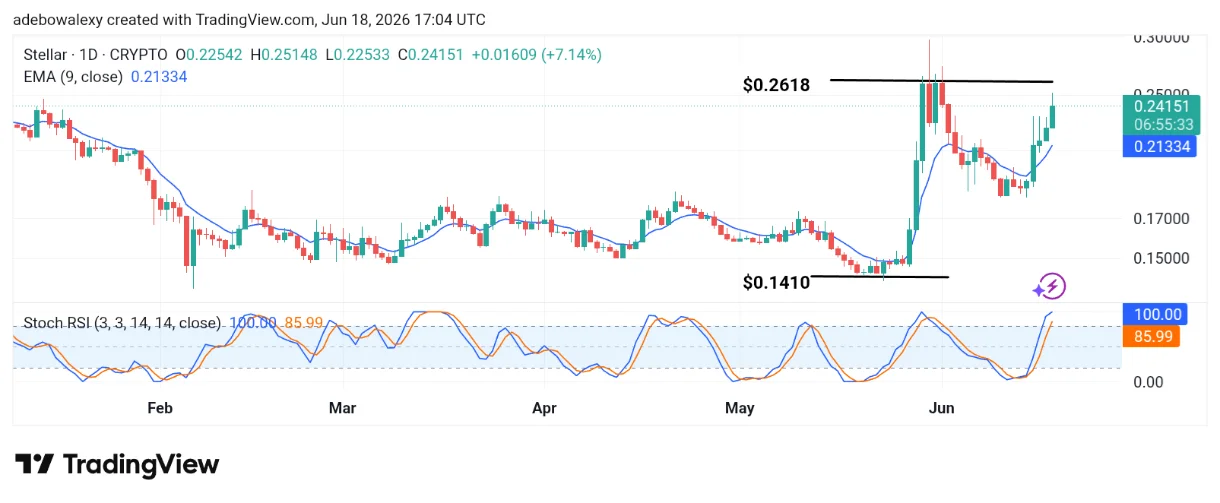
Although a price ceiling was reached on June 1, resulting in a downward retracement, price action has returned to bullish territory over the past four sessions. This recovery occurred as the market moved above the 9-day Exponential Moving Average (EMA). Meanwhile, the Stochastic Relative Strength Index (SRSI) has risen into the overbought region.
Why the Current Move in the Stellar Market Seems Mixed
Bullish momentum in this market appears strong and particularly impressive considering the recent bearish correction across financial markets. The price action has successfully surpassed the 9-day EMA and continues to receive support from it.
However, the current session has experienced a noticeable pullback, leaving the day’s candle with an upper shadow, which suggests selling pressure at higher levels. Additionally, the lead line of the Stochastic Relative Strength Index has reached the 100 level, indicating an overbought condition.
What Traders May Anticipate
Despite the mixed signals, the market may still have room to move higher. This view is supported by the fact that price action remains comfortably above the 9-day EMA. Furthermore, although the SRSI lines are above the 70 level, today’s candle continues to display solid bullish strength.
As a result, traders may remain optimistic about a move toward the psychologically important $0.3000 resistance level.