Litecoin (LTC) Price Prediction: LTC/USDT Market Rebounds Downward
Estimated Reading Time: 3 minutes
Don’t invest unless you’re prepared to lose all the money you invest. This is a high-risk investment and you are unlikely to be protected if something goes wrong. Take 2 minutes to learn more
Litecoin Price Prediction for November 26
As it is well known, the Litecoin token usually tracks Bitcoin’s price and has gained considerable price increases in recent times. The market can be seen to have punched its way through the $100 mark as well as the $105 resistance level. However, the market soon retreated below the $100 price level and currently hovers just below the $95 mark.
LTC/USDT Long-Term Trend: Bearish (Daily Chart)
Key Price Levels:
Resistance: $95.00, $100.00, $105.00
Support: $90.00, $85.00, $80.00
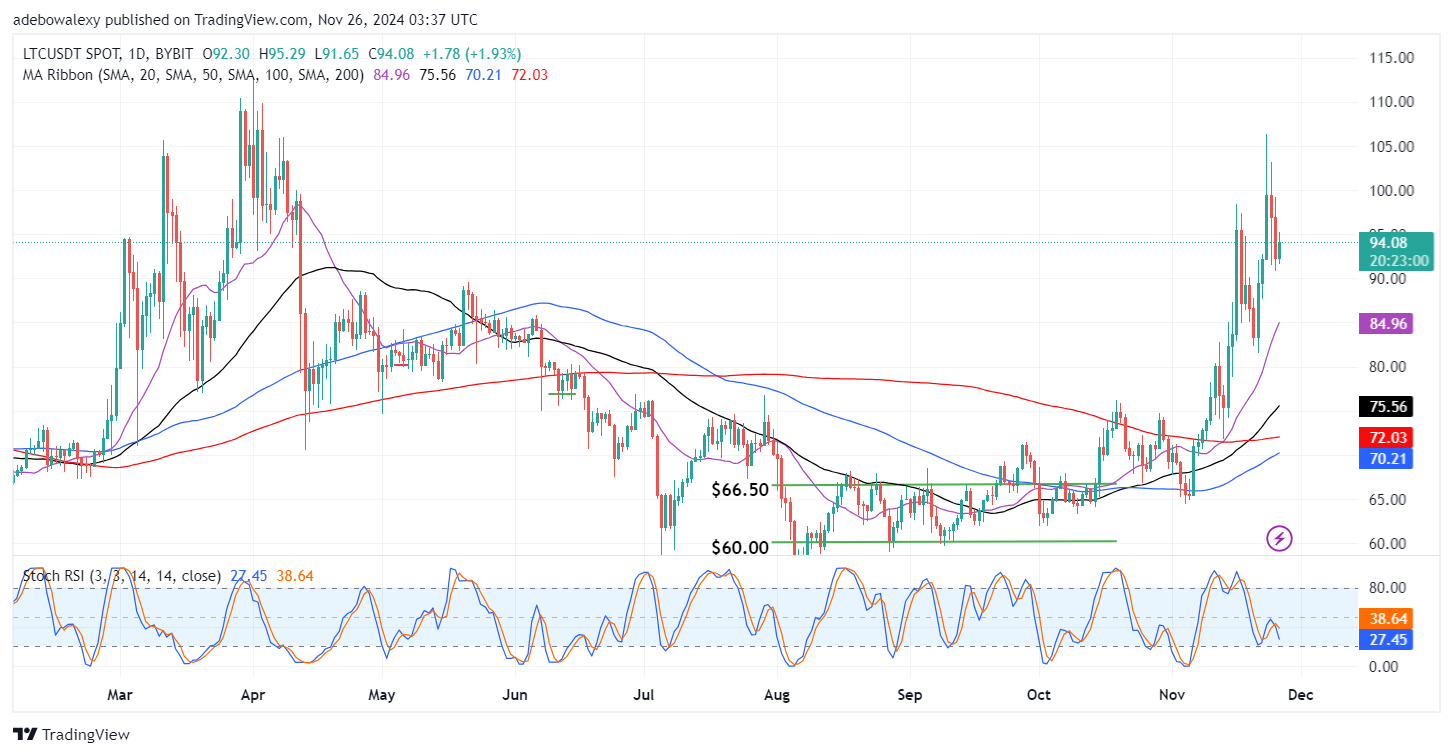
The last price candle on Litecoin’s daily price chart has appeared green. Also, this has appeared above all the Moving Average (MA) lines and at a good distance too. Meanwhile, the Stochastic Relative Strength Index (RSI) lines can be seen falling sharply into the oversold region following a crossover at the 40 level of the indicator. At this point, price action in this market seems to be testing the $95 resistance price level.
Litecoin (LTC) Price Prediction: LTC/USDT Suspends Above the $90.00 Mark
Price activity in the Litecoin daily market can be seen to surely suggest that upside forces are pulling the brakes. This market has retraced downward over the past two sessions. However, the ongoing session can be seen to have produced some upside rebound. This brought the market to now test the $95.00 mark.
Additionally, with the price action now above all the MA lines, it does seem easy for price action to proceed upwards. Albeit, the Stochastic RSI indicator curves still have a bearish view of the market. This can be observed as the indicator curves are falling toward the 29 level of the indicator. Nevertheless, upside forces are more predisposed to retain their newfound trajectory.
Litecoin (LTC) Price Prediction: Bears in the LTC/USDT Market Still in an Uptrend (4-Hour Chart)
Price activity in the Litecoin 4-hour market has revealed that price action is in a clear uptrend. Since the 10th of November, Litecoin on the 4-hour chart can be seen to have started finding higher support levels. This has been clearly mapped out by the drawn upside-sloping trendline. The last price candle here stands above the 50-day MA and the upside-sloping trendline. Meanwhile, the Stochastic RSI lines can be seen converging just below the 20 mark of the indicator.
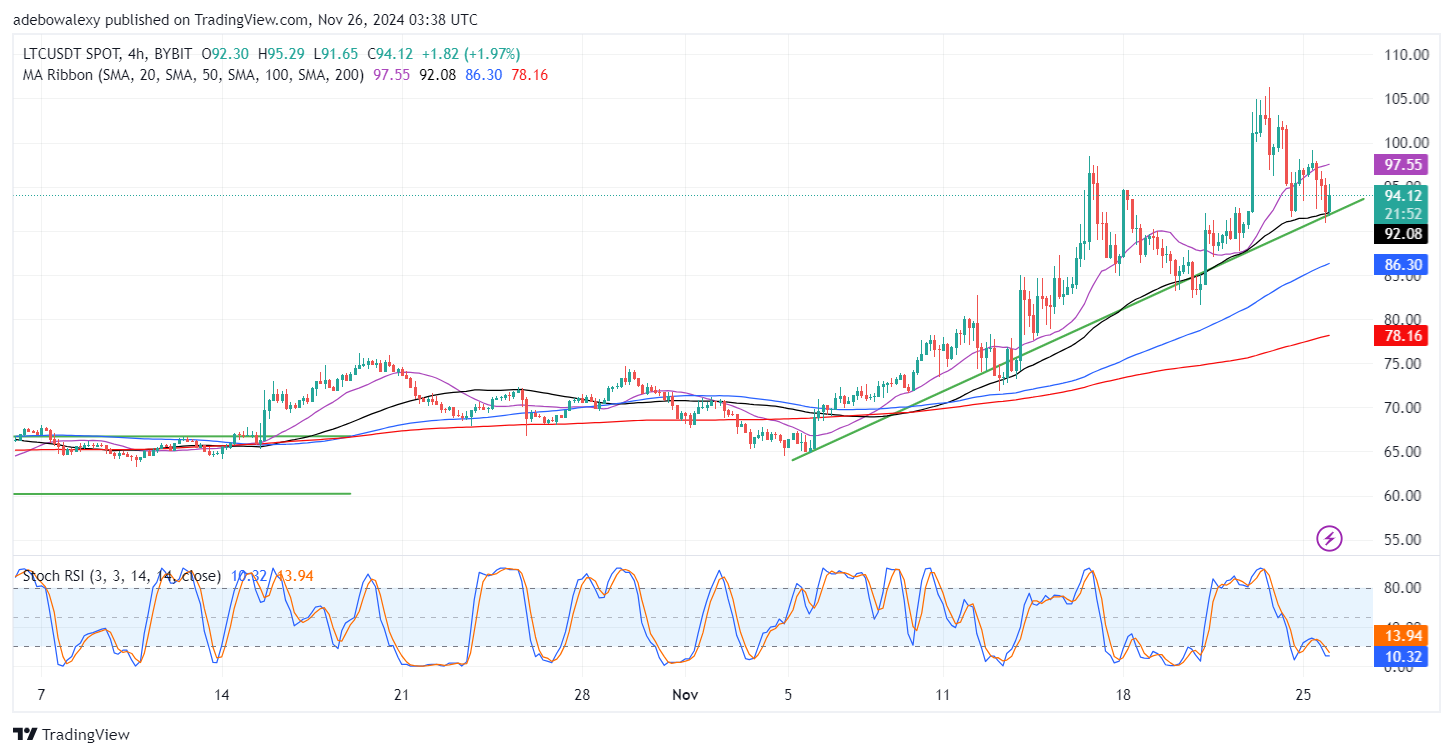
This aligns with the upside rebound presented by the last price candle on the chart to hint that upside forces may have regained control of price movement as usual. Therefore, it does seem that this market may proceed through the $95 price level shortly and may subsequently proceed toward the $100.00 mark.