Dogecoin (DOGE) Price Prediction: DOGE/USDT Market Rebounds Downward
Estimated Reading Time: 3 minutes
Don’t invest unless you’re prepared to lose all the money you invest. This is a high-risk investment and you are unlikely to be protected if something goes wrong. Take 2 minutes to learn more
Dogecoin Price Prediction for November 25
The Dogecoin market has risen considerably ever since bulls in the market became explosive. The bullish explosion brought the market to test the $0.4500 price level for two sessions. However, the market has continued to retract below the mentioned price level subsequently.
DOGE/USDT Long-Term Trend: Bearish (Daily Chart)
Key Price Levels:
Resistance: $0.4500, $0.5000, $0.5500
Support: $0.4000, $0.3500, $0.3000
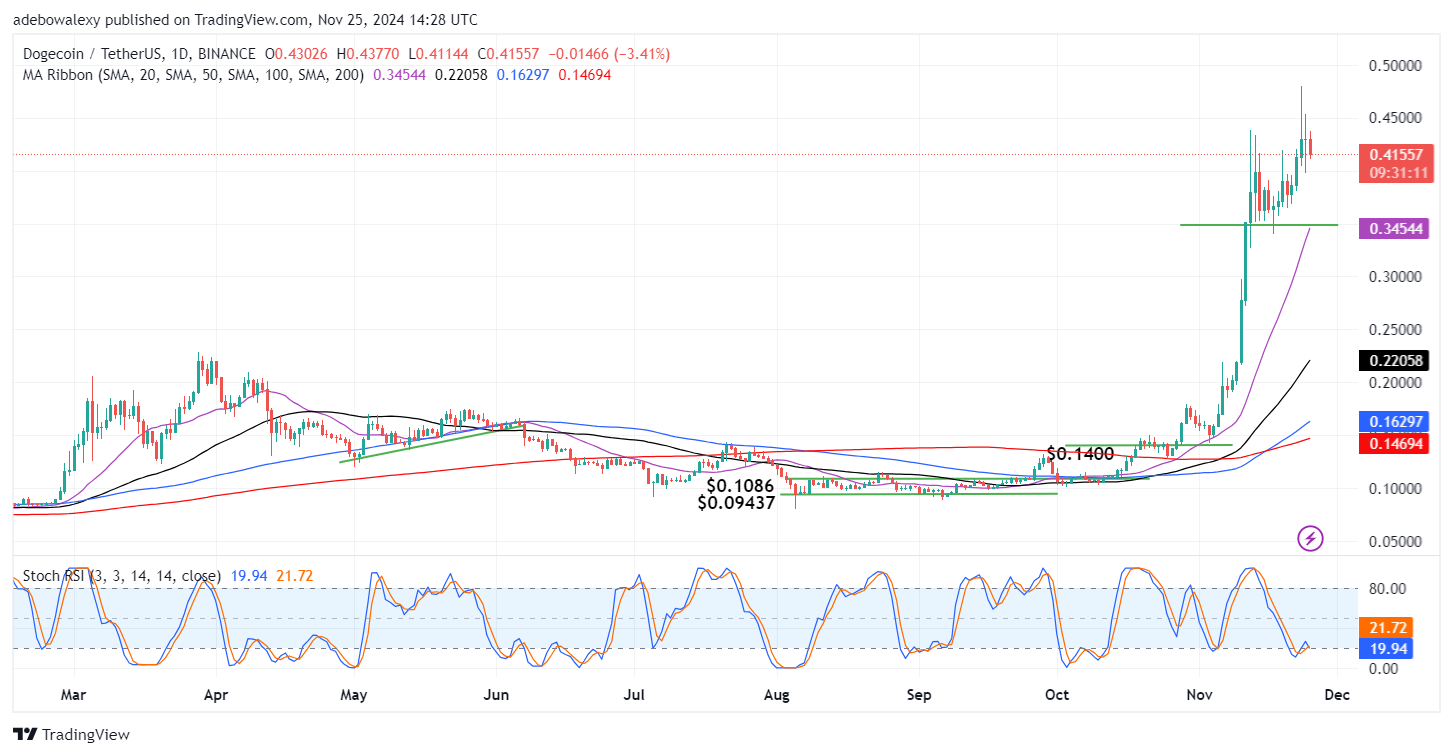
The last price candle on the chart has provided a considerable price decrease as of today’s trading activity. Despite this, Dogecoin still trades at a significant distance above the Moving Average (MA) ribbons. Likewise, the coin also trades above the $0.4000 mark. Also, the Stochastic Relative Strength Index (RSI) lines can be seen at a bearish crossover at the 20 mark of the indicator.
Dogecoin (DOGE) Price Prediction: DOGE/USDT Sees a Strong Rejection
Price activity in the Dogecoin market has seen a moderate downward retracement. Nevertheless, the market continues to trade at quite a distance above the MA lines. Technically, this gives bullish sentiments some cushion. Also, since the market continues to trade above the $0.4000 price level, that price level still acts as a potential support for the market.
Furthermore, the Stochastic RSI lines have just delivered a bearish crossover above the 20 mark of the indicator. Technically, this thus suggests that price action may fall lower. However, since the lines of the indicator remain in the oversold region, downward retracement may now have much room to cause a stronger price decline.
Dogecoin (DOGE) Price Prediction: Bears in the DOGE/USDT Market Take on a Threatening Look (4-Hour Chart)
Although the DOGE/USDT market still has some cushion, the 4-hour market seems to threaten bullish traders. The last price candle on the chart has fallen below the 20-day MA line. Other MA lines lie below price activity. Also, the earlier crossover seen on the daily chart can be seen to have been affected in the 4-hour chart. The ensuing lines of the indicator can be seen falling slightly deeper into the oversold region.
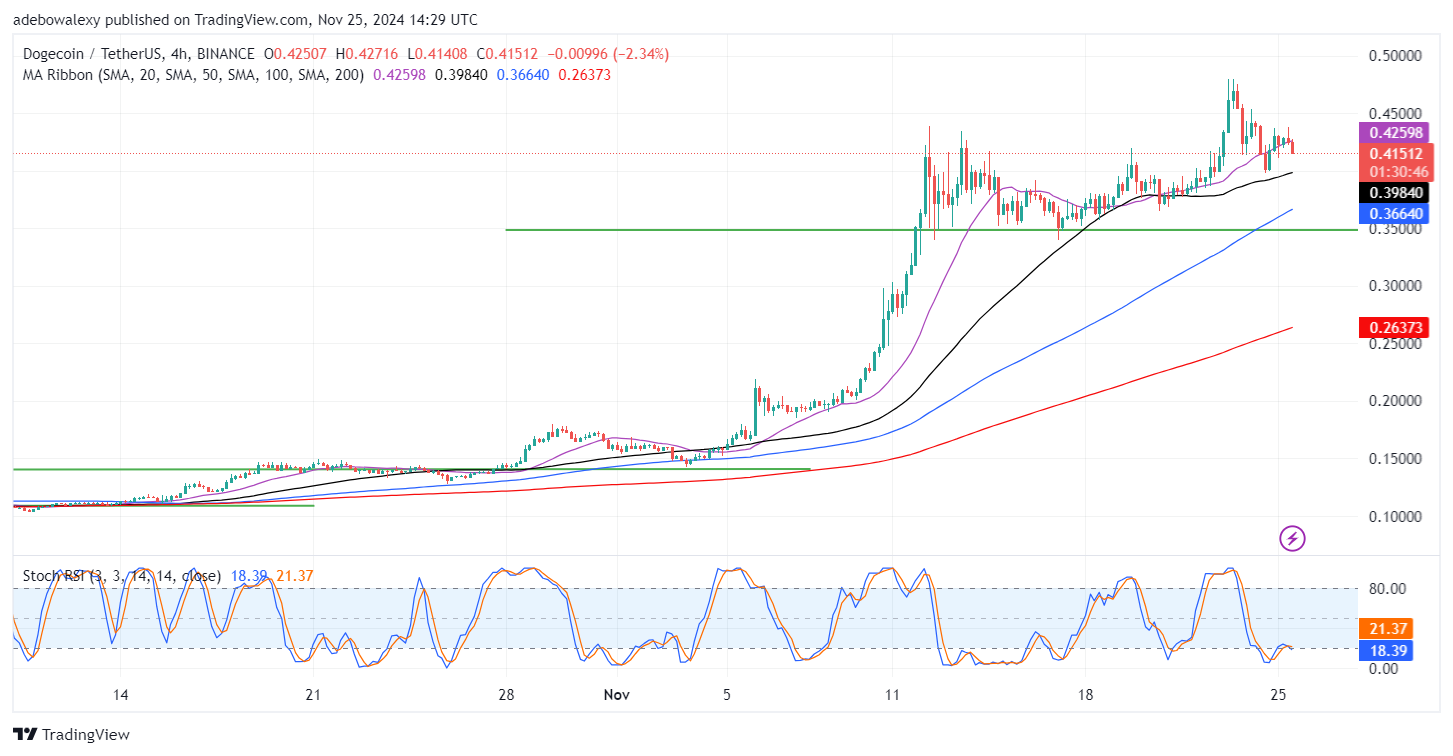
Technical indicators in the 4-hour market are pointing to the fact that price activity may fall lower. However, the slow progression of price action offers bullish traders some hope that the market may not fall considerably. Also, the last price candle can be seen at some distance above the psychological support level of $0.4000. As a result, two things may happen here: should the downward retracement extend, the $0.4000 mark may offer a potential rebound point for the market.