ZKsync (ZK/USD) May Be Preparing for a Rebound
Estimated Reading Time: 3 minutes
Don’t invest unless you’re prepared to lose all the money you invest. This is a high-risk investment and you are unlikely to be protected if something goes wrong. Take 2 minutes to learn more

The ZKsync market has remained in a sustained bearish trend following the last bullish rally, which peaked near the $0.09 price level in early November. From this high, bearish pressure intensified, triggering a prolonged decline that has driven price back toward the $0.03 level. Notably, this zone represents the origin of the previous bullish breakout, making it a technically significant support area.
As price approaches this key level, downside momentum appears to be weakening, suggesting that selling pressure is gradually fading. The slowdown in price action near this critical support raises the possibility of a stabilization phase and increases the likelihood of a potential rebound, should buyers begin to defend the zone.
ZKsync (ZKUSD) Market Data
- ZK/USD Price Now: $0.03116
- ZK/USD Market Capitalization: $325 million
- ZK/USD Circulating Supply: 10.6 billion ZK
- ZK/USD Total Supply: 13.96 billion ZK
- ZK/USD CoinMarketCap Ranking: #128
Key Levels to Watch
- Resistance: 0.0350, $0.0400, $0.0500
- Support: $0.030, $0.025, $0.020
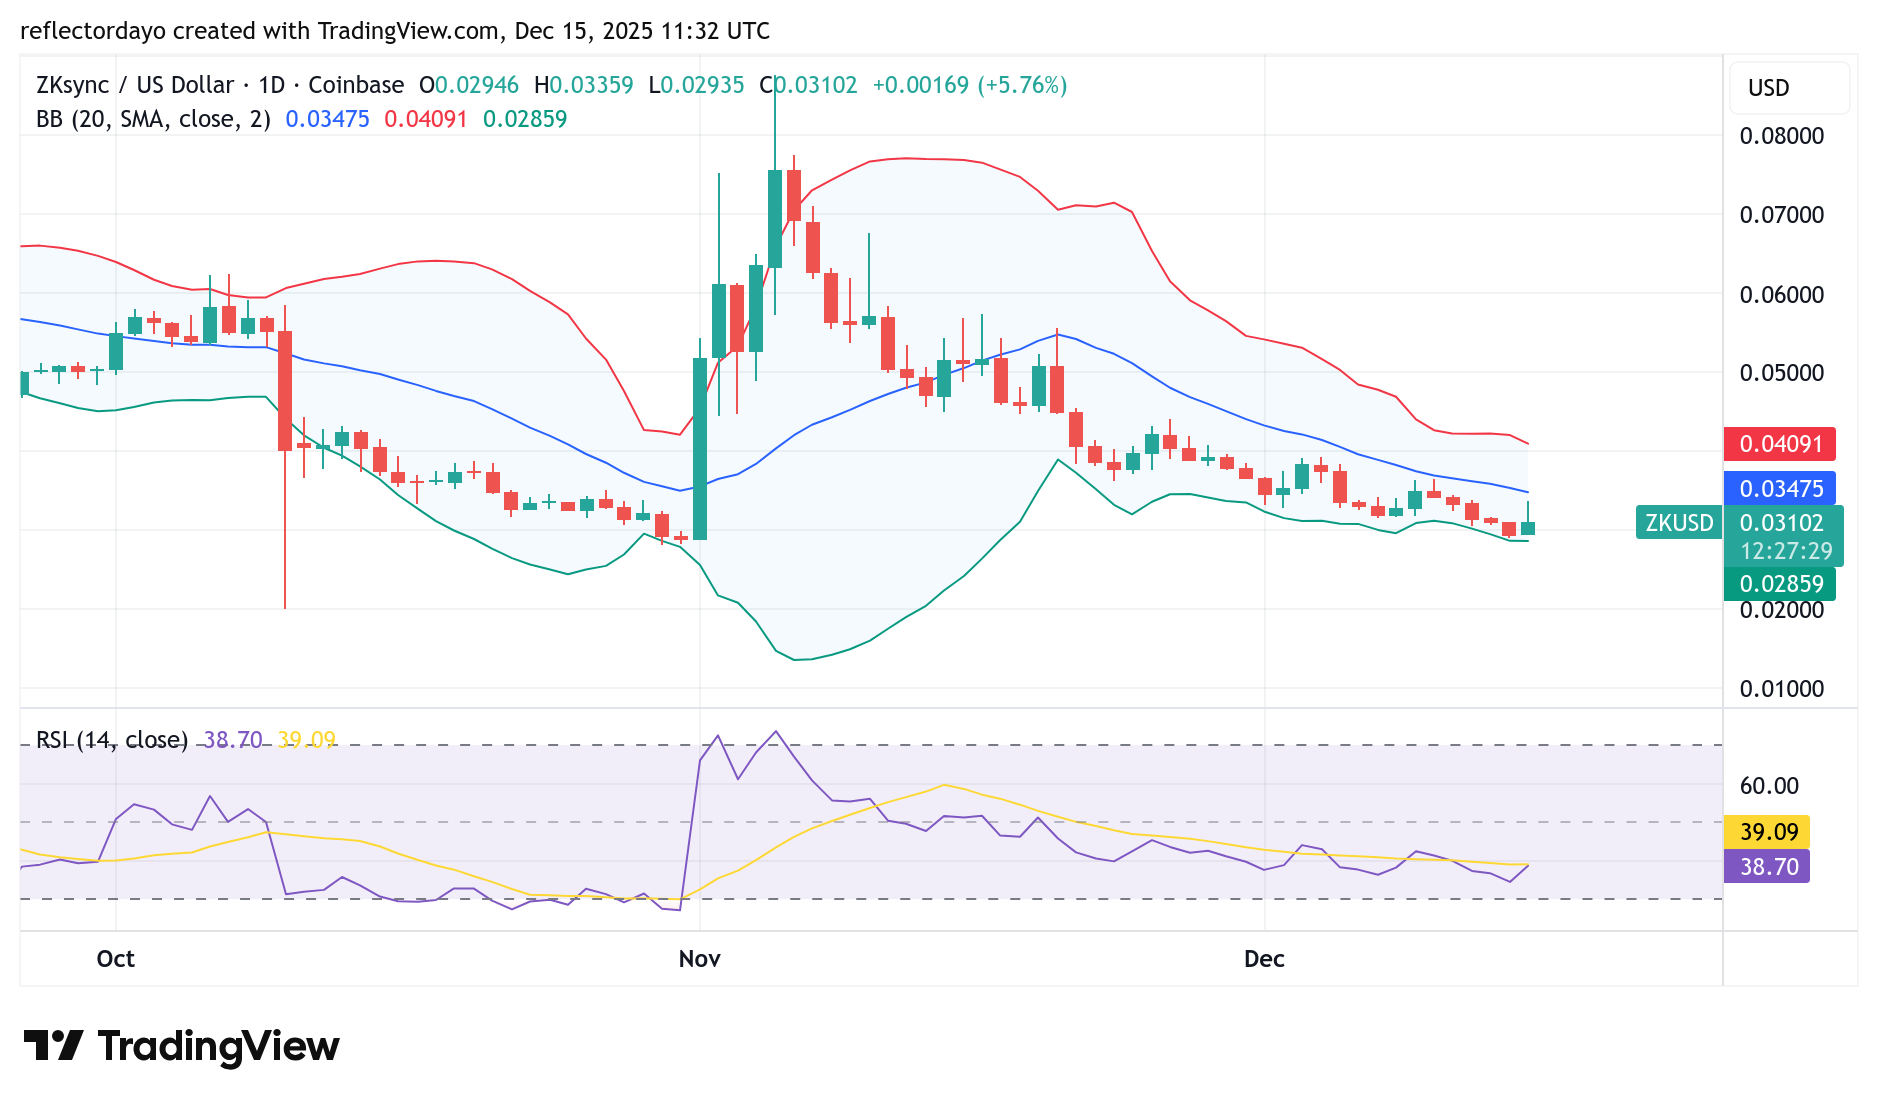
ZKsync (ZK/USD) Daily Chart Analysis
What we observe on the daily chart, supported by technical indicators, is a bearish trend that is gradually losing momentum. Although both lower highs and lower lows remain intact, the highs are declining at a faster rate than the lows, forming a falling wedge pattern—a structure that often signals weakening bearish pressure.
As the downtrend loses strength, this development in the crypto signal could indicate that a potential rebound is approaching. Recent price action over the past two sessions suggests that buyers are beginning to gain a foothold around the critical $0.03 support level. While strong bullish momentum has not yet emerged, the current behavior points toward a possible accumulation phase, which could precede a rebound and a shift toward upward price movement.
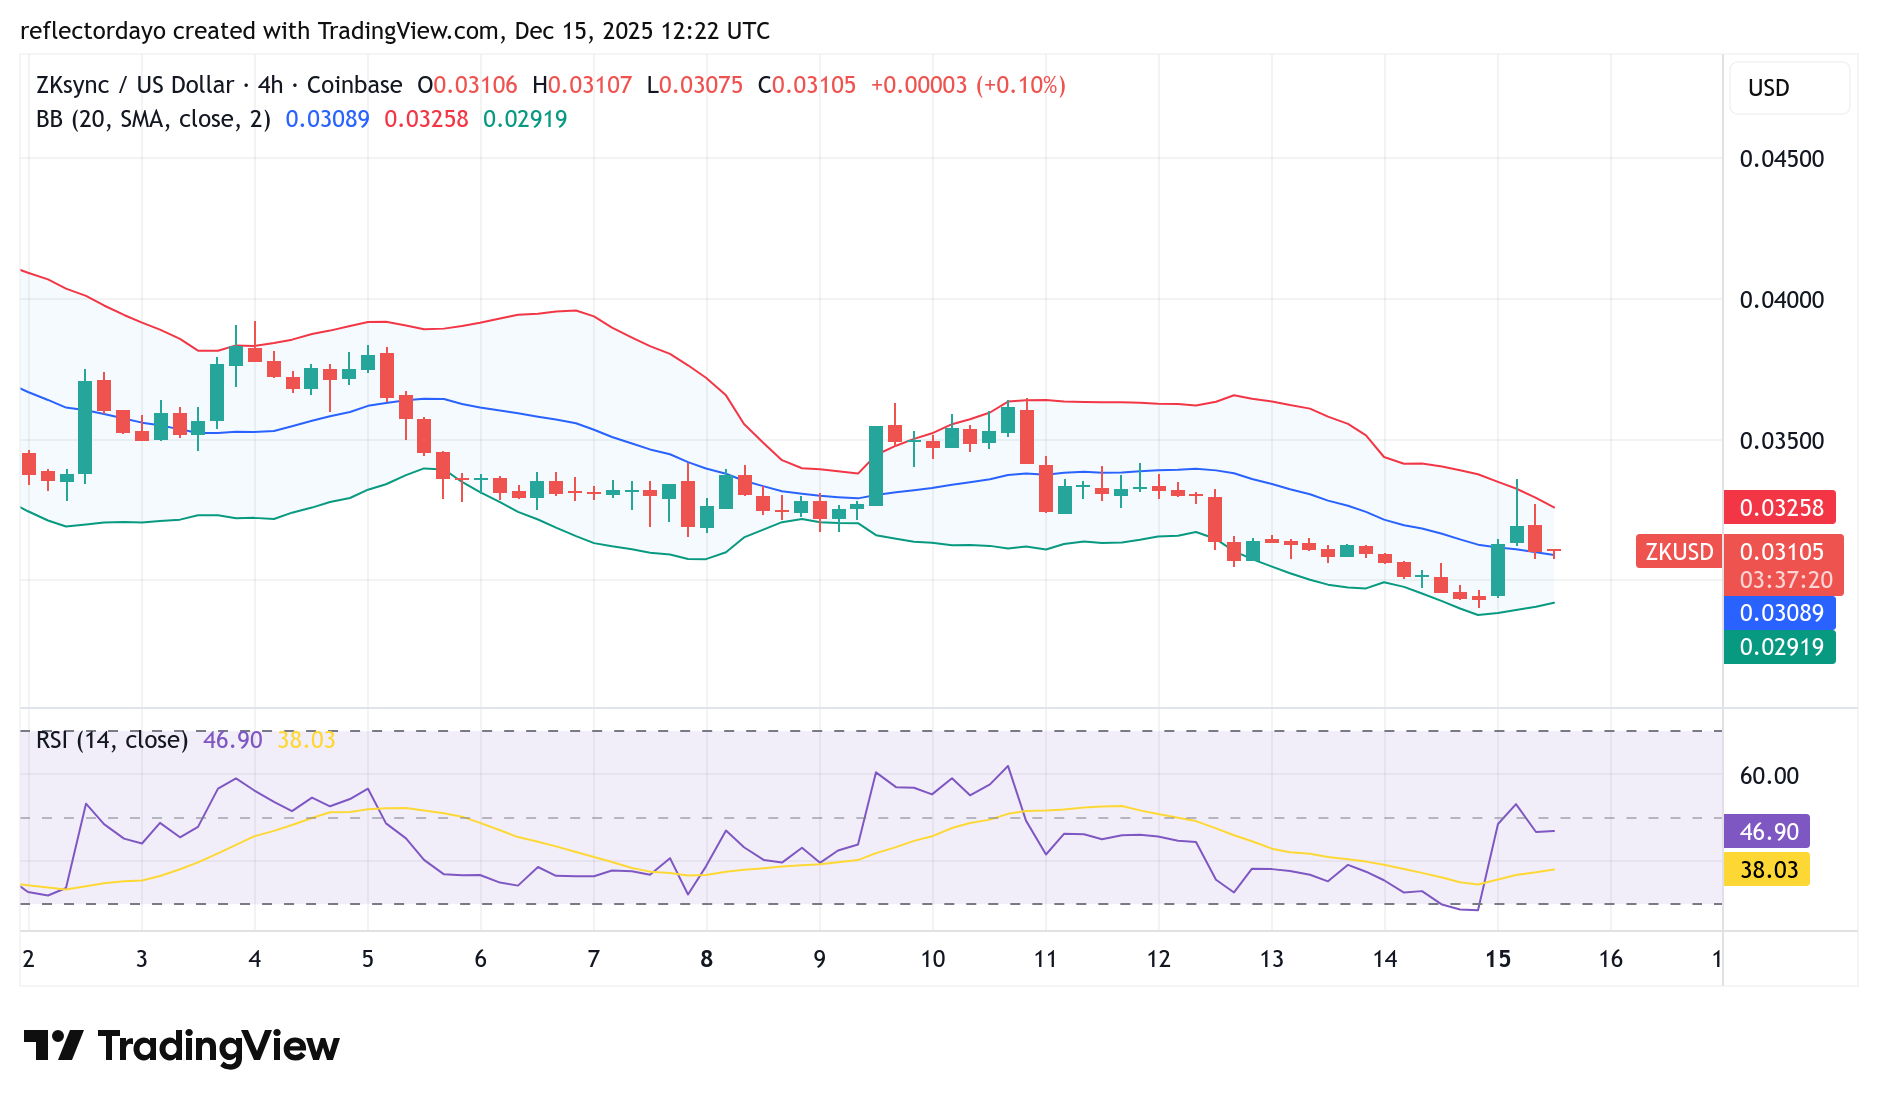
ZK/USD 4-Hour Chart Outlook
Zooming into a lower timeframe, such as the 4-hour chart, technical indicators suggest that the market is currently trading around its midpoint, signaling indecision among market participants. However, this standoff near the latter stage of a downtrend can often precede a potential rebound.
This behavior may indicate that bearish momentum is becoming exhausted, creating room for a possible shift toward bullish sentiment in the near term.