XDC Network (XDC/USD) Bulls Absorb Bearish Sentiment at $0.05
Estimated Reading Time: 3 minutes
Don’t invest unless you’re prepared to lose all the money you invest. This is a high-risk investment and you are unlikely to be protected if something goes wrong. Take 2 minutes to learn more

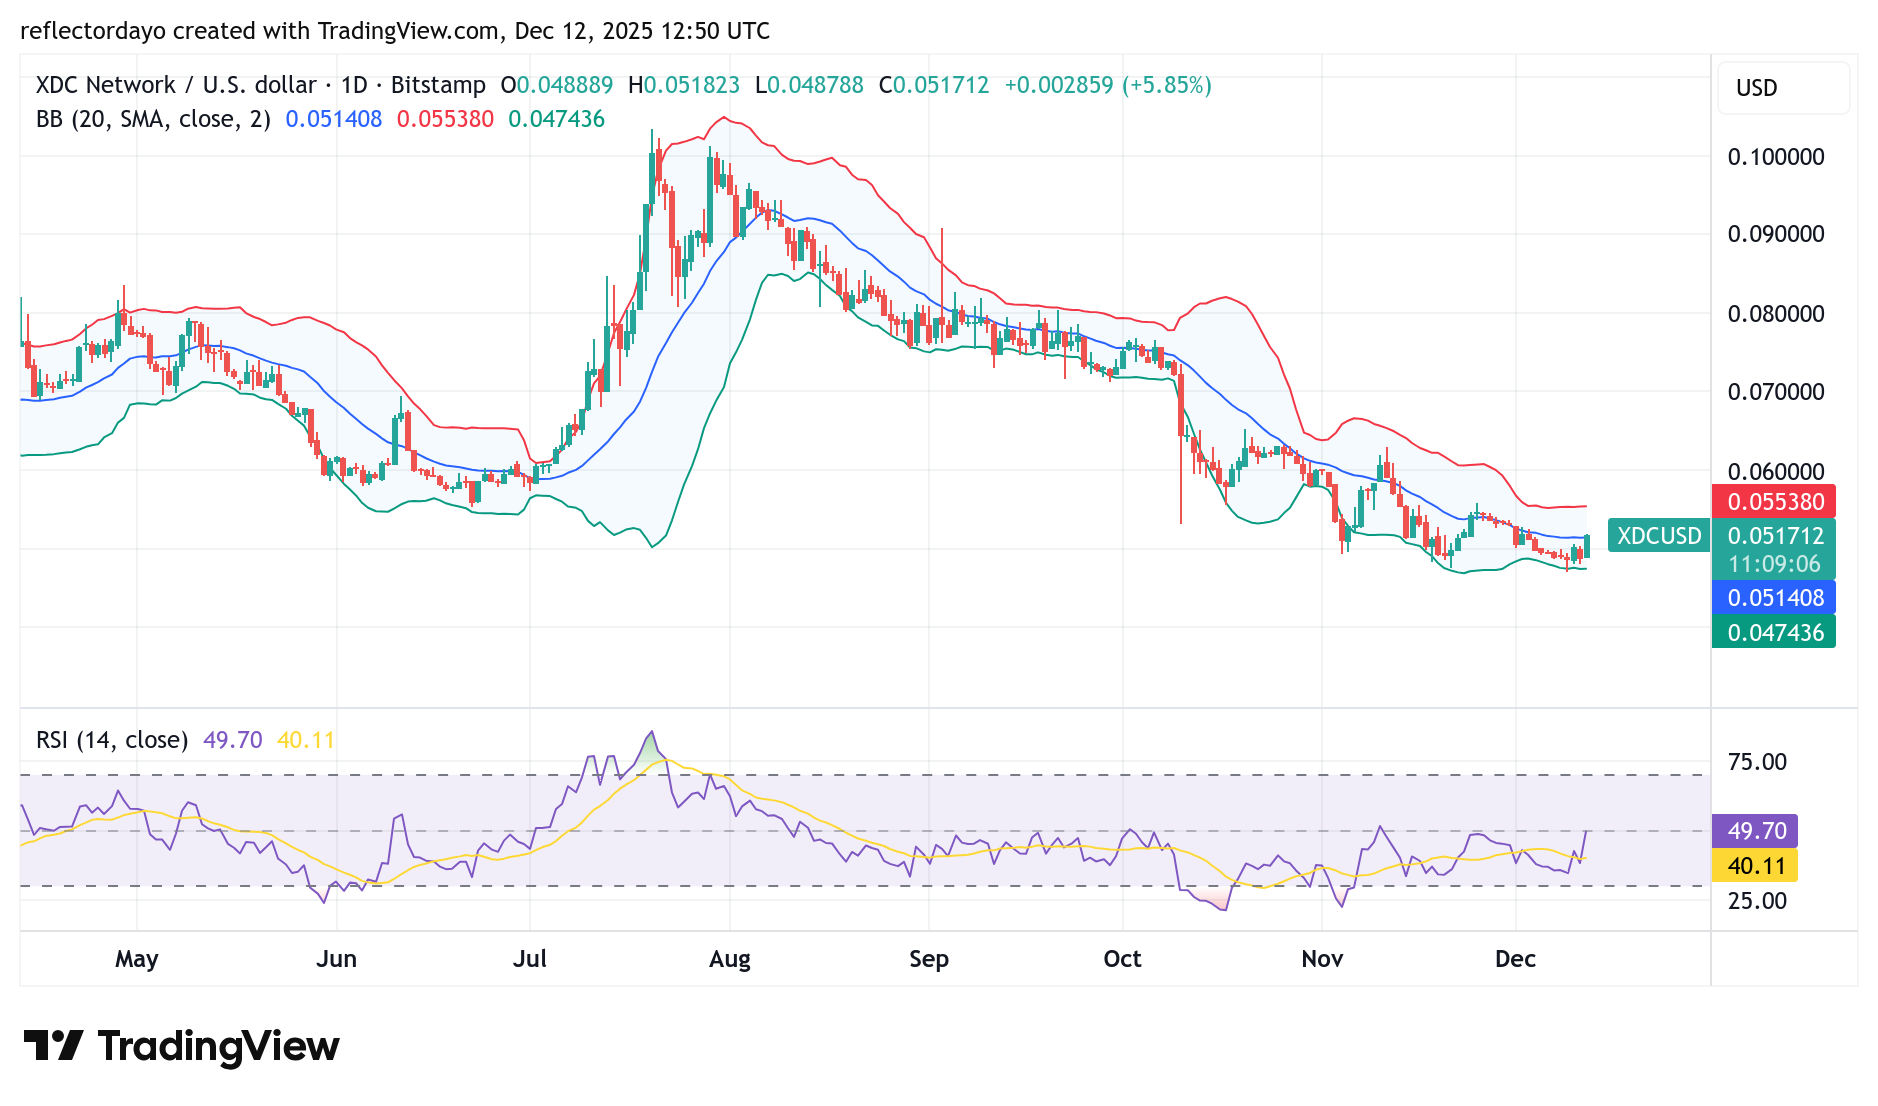
The market has experienced a prolonged bearish run since peaking at the $0.10 price level in late July. After the downturn began at $0.10, bearish momentum strengthened and pushed the market deeper into lower price zones. Bullish interest at the $0.06 level failed to withstand the intensity of the bearish pressure.
The reason $0.06 was considered a critical level at the time (around October, when the bearish trend briefly paused there) is that it marked the starting point of the previous bullish rally. Because of this, traders expected the bearish trend to reverse at that level. However, this did not happen, as the bears remained unrelenting. Bulls were forced to give way, and the price eventually fell below this critical support zone.
XDC Network (XDCUSD) Market Data
- XDC/USD Price Now: $0.0517
- XDC/USD Market Capitalization: $959 million
- XDC/USD Circulating Supply: 18.5 billion XDC
- XDC/USD Total Supply: 38 billion XDC
- XDC/USD CoinMarketCap Ranking: #66
Key Levels to Watch
- Resistance: 0.06, $0.07, $0.08
- Support: $0.045, $0.040, $0.035
XDC Network (XDC/USD) Daily Chart Analysis
Breaking below the critical $0.06 price level triggered a significant surge in market volatility. While some XDC traders believe the market may face a deeper decline, bulls have regrouped at the $0.05 support level, resulting in volatile price behavior. Although bears have attempted to take advantage of this volatility, bulls are showing resilience at $0.05.
In today’s trading session, the market rebounded from the $0.05 threshold and reached $0.051, which aligns with the current position of the 20-day moving average. This bullish recovery appears promising, but it will not be considered a strong reversal until the price breaks above the $0.055 resistance.
If the market fails to move past the $0.051 level, two possible outcomes may unfold:
- Bears could overpower the bulls again, pushing the price lower, or
- The market could continue consolidating at this level before determining its next direction.
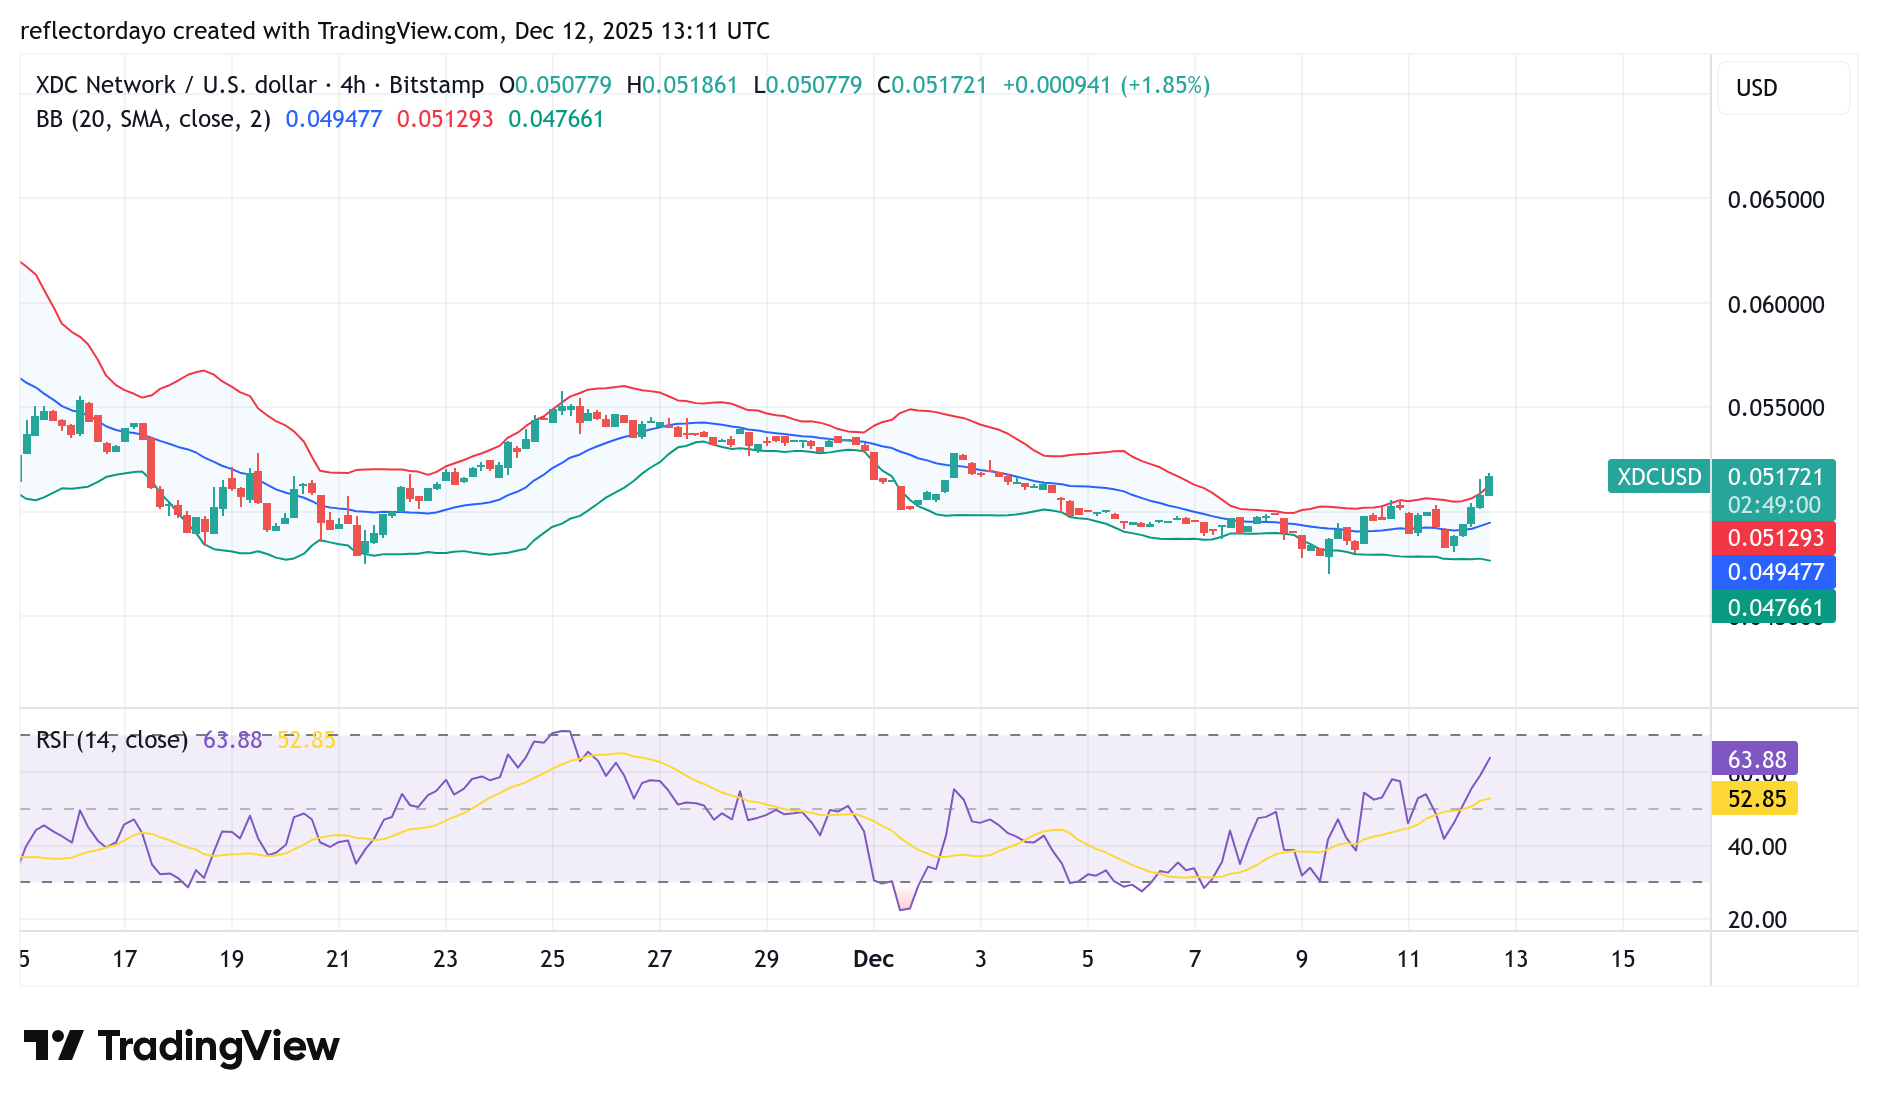
XDC/USD 4-Hour Chart Outlook
On the smaller timeframe, the price action is surging upward, and we can see that a new resistance level has formed at $0.051. The emergence of this resistance makes the ongoing bullish recovery questionable. Whether investor confidence will grow in this recovery depends largely on how the market behaves at the $0.051 level and whether it can successfully break above it.