Litecoin (LTC) Price Prediction: LTC/USDT May Recover Towards Higher Price Levels
Estimated Reading Time: 3 minutes
Don’t invest unless you’re prepared to lose all the money you invest. This is a high-risk investment and you are unlikely to be protected if something goes wrong. Take 2 minutes to learn more

Litecoin (LTC) Price Prediction: October 8
Price movement in the Litecoin market seems hesitant above the $66.50 threshold. As a result, the market has retreated below that level. However, price activity appears resilient and may attempt to break the mentioned resistance once more.
LTC/USDT Long-term Trend: Bullish (Daily Chart)
Key Price Levels:
Resistance: $70.00, $75.00, $80.00
Support: $65.00, $60.00, $55.00
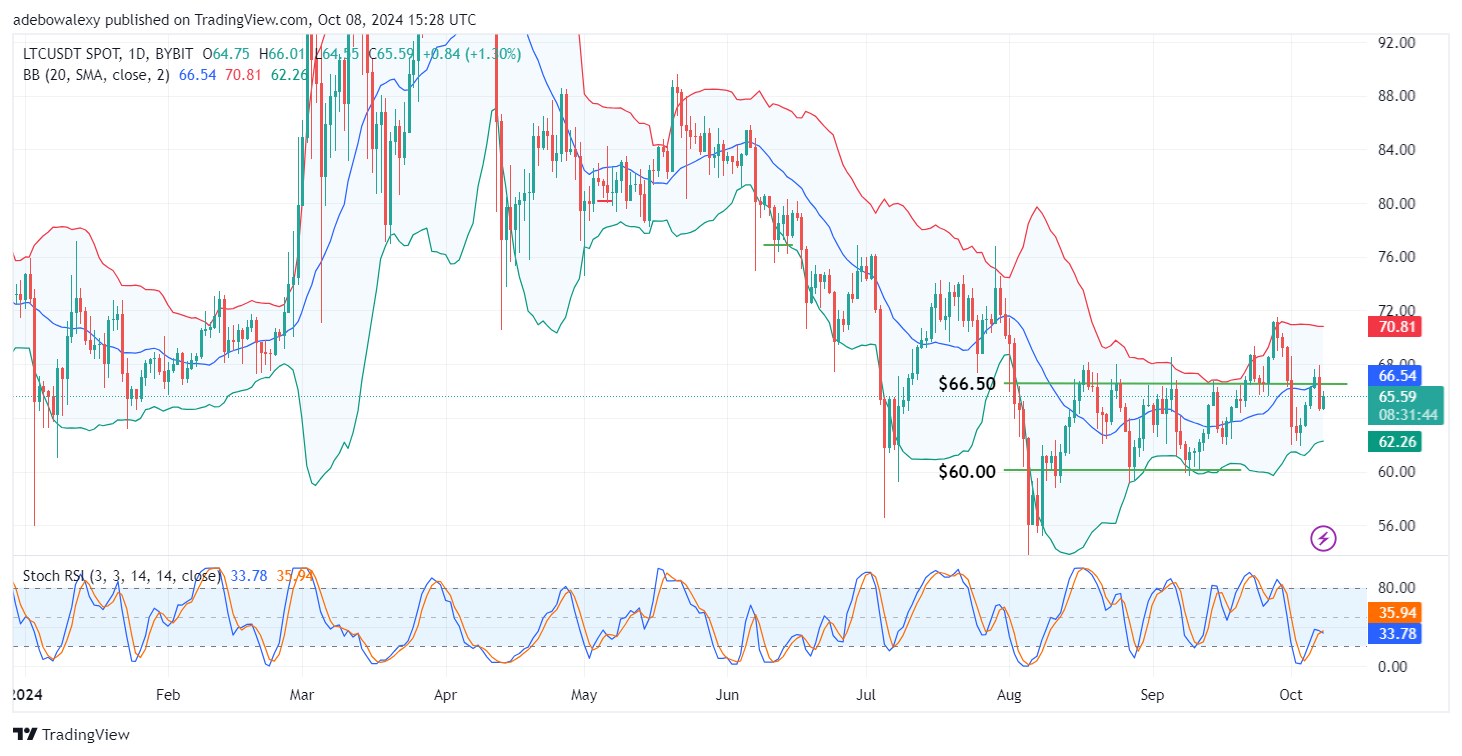
Price action saw a sharp decline in the previous session, causing Litecoin’s price to retreat below the $66.50 threshold. The ongoing session shows a solid green candle below the middle limit of the Bollinger Bands (BB) indicator. Additionally, the latest price candle has an upper shadow but remains green. Meanwhile, the Stochastic Relative Strength Index (Stochastic RSI) lines are now delivering a crossover as they approach the 40 mark of the indicator.
Litecoin (LTC) Price Prediction: LTC/USDT Bulls Are Trying to Maintain Influence
Litecoin’s price action has fallen below the middle limit of the Bollinger Bands (BB) indicator, suggesting that downward forces are attempting to maintain control. However, the last price candle on the chart indicates that buyers are still in control of the session, despite the price being below the middle limit of the BB indicator. The upper shadow on the price candle shows that bearish pressure hasn’t been entirely neutralized.
It is important to note that the Stochastic RSI has delivered a crossover while still below the 40 level. Nevertheless, the lines are trending sideways, indicating considerable buying activity during the session.
Litecoin (LTC) Price Prediction: LTC/USDT Sees Rejection at the $66.00 Threshold (4-Hour Chart)
The Litecoin market has rebounded upwards over the past three sessions. However, there have been some interruptions along the way, as seen in the price candles. Trading activity remains below the middle band of the BB indicator. The last price candle shows the market facing downward rejection in the session, though the Stochastic RSI lines are rising.
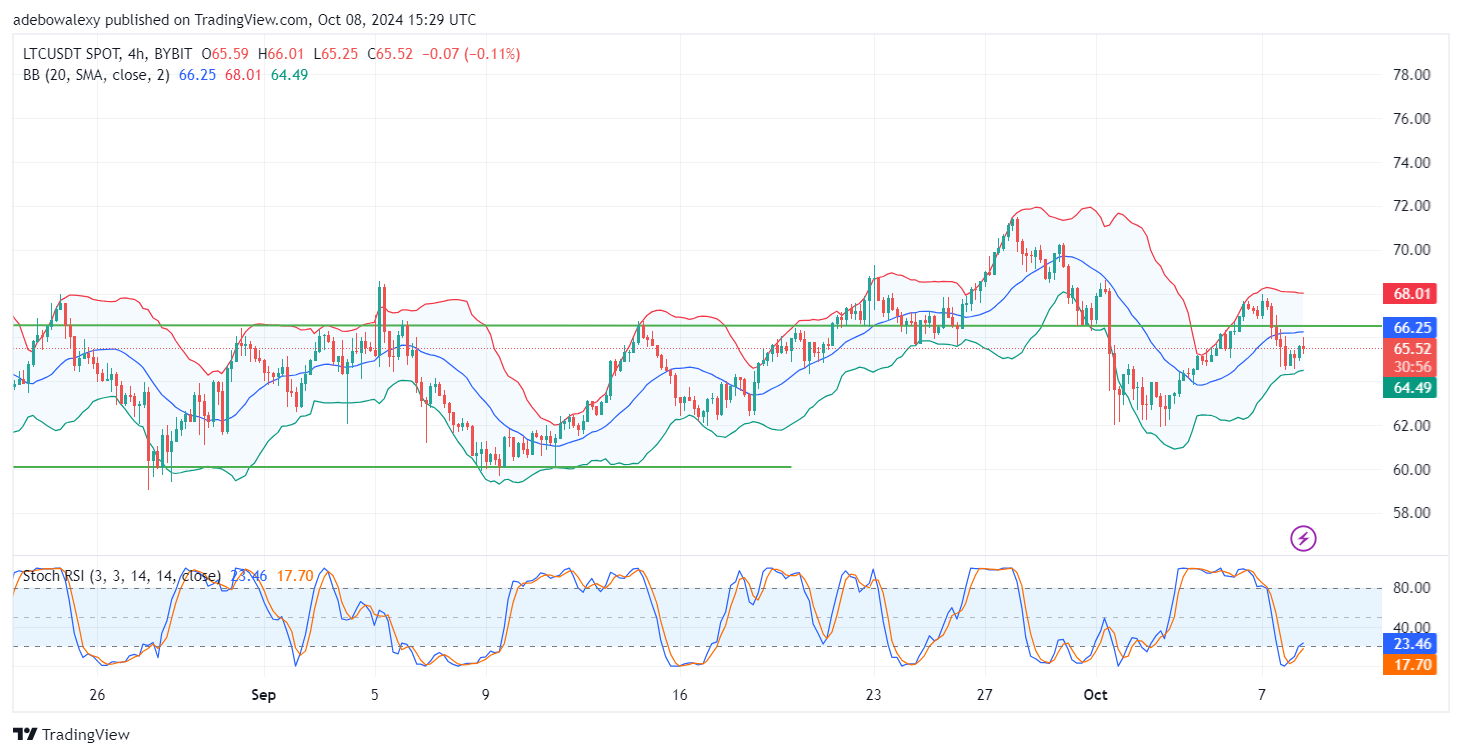
Overall, price activity in this market suggests an upward trend. The Stochastic RSI lines are also continuing to rise. Technically, this maintains the likelihood of upward price movement in the ongoing session, so trading activity may still target the $68.00 mark.