Uniswap (UNI) Price Prediction: UNI/USDT Resumes Trading Below the $7.00 Threshold
Estimated Reading Time: 2 minutes
Don’t invest unless you’re prepared to lose all the money you invest. This is a high-risk investment and you are unlikely to be protected if something goes wrong. Take 2 minutes to learn more
Uniswap (UNI) Price Prediction: October 6
The price of the Uniswap token recently rose above the $7.00 resistance level. However, it encountered headwinds, causing the price to fall below the $7.00 level. Additionally, the market appears burdened, struggling to hold above key levels.
UNI/USDT Long-term Trend: Bearish (Daily Chart)
Key Price Levels:
Resistance: $7.00, $7.50, $8.00
Support: $6.00, $5.50, $5.00
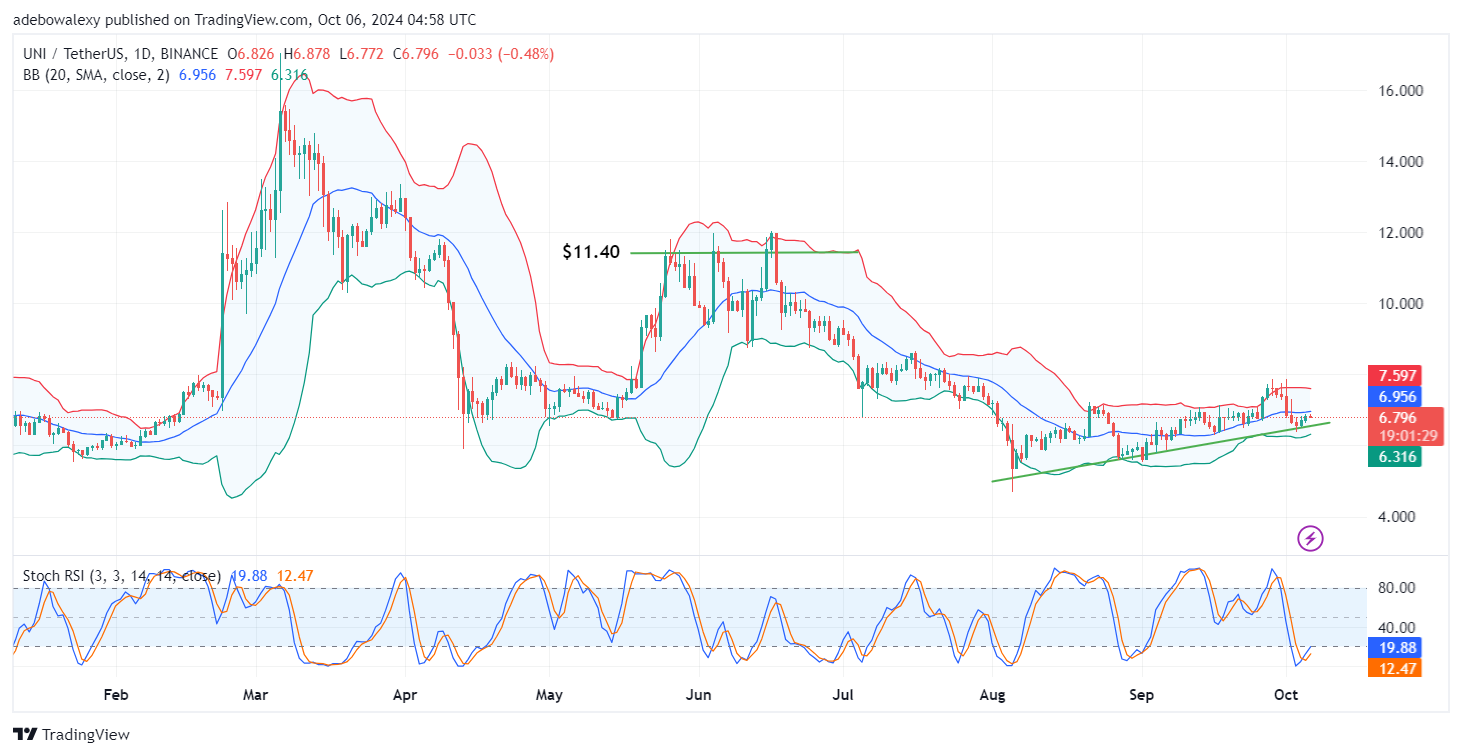
The Uniswap market has dropped back below the $7.00 threshold. The price action has also bounced off support from an upward-sloping trendline. Meanwhile, the current price candle has turned red near the middle of the Bollinger Bands (BB) indicator. Nonetheless, the Stochastic Relative Strength Index (Stochastic RSI) lines maintain their upward trajectory after an upward crossover in the oversold region.
Uniswap (UNI) Price Prediction: UNI/USDT Bulls Are Struggling Below Key Levels
The UNI/USDT market has experienced low volatility since its price fell back below the middle of the BB indicator. However, in recent sessions, the market has shown a slight retracement to higher levels. As a result, the market has maintained a mild upward trajectory.
The Stochastic RSI lines are still rising, despite a slight downward retracement in the ongoing session. The token continues to trade below the middle of the BB indicator, but the behavior of the Stochastic RSI suggests that the market may move upward.
Uniswap (UNI) Price Prediction: Is the UNI/USDT Market Attempting a Trend Continuation? (4-Hour Chart)
Price action in the Uniswap 4-hour market has risen above the middle of the BB indicator. However, the last two price candles on the chart suggest a bearish trend. Despite this, price action remains above this technical landmark. It can also be seen that the Stochastic RSI is approaching an upward crossover just above the 80 level of the indicator.
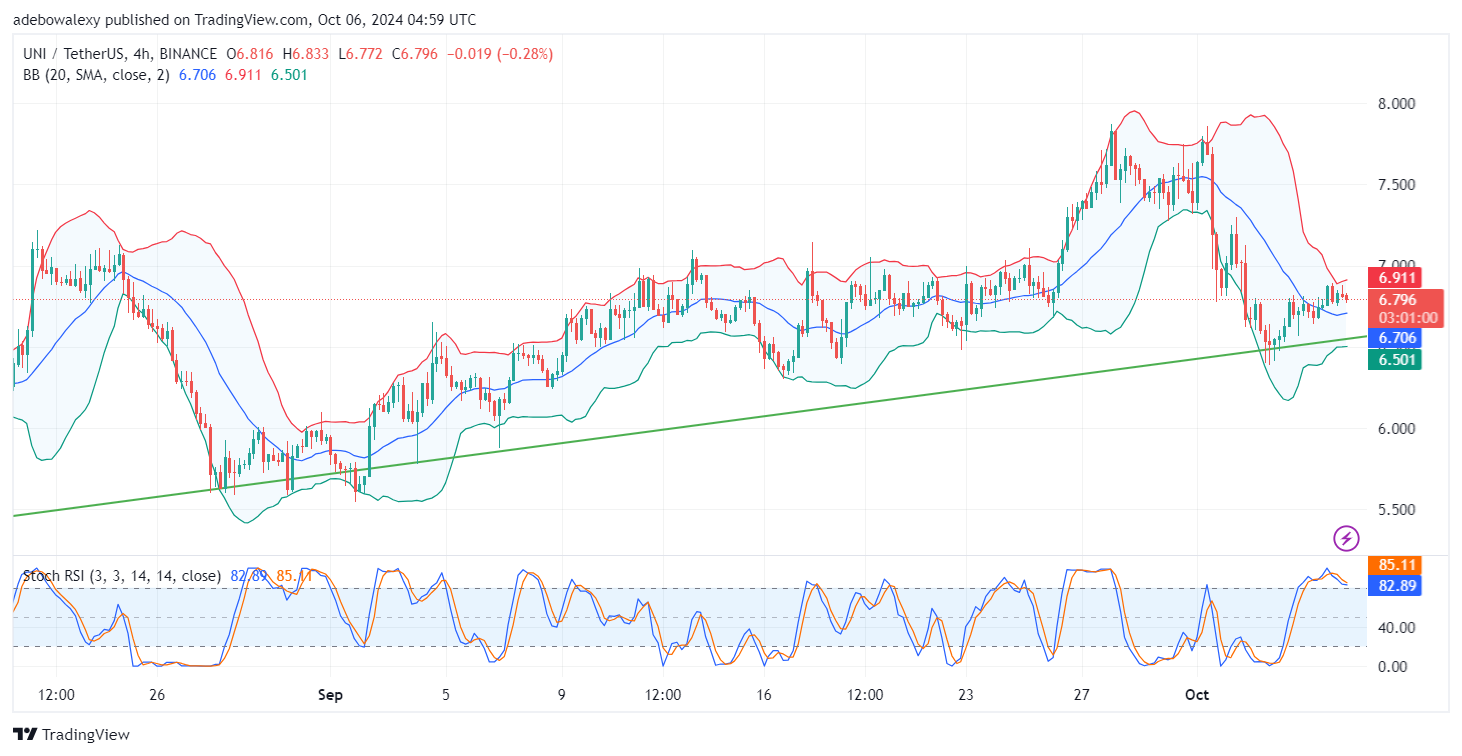
Indications from technical indicators suggest that price action may proceed toward higher levels. Therefore, traders may aim for the price to surpass the $7.00 mark, potentially reaching the $7.50 threshold.