Litecoin (LTC/USD) Market Responses to a Decline Beneath $95
Estimated Reading Time: 3 minutes
Don’t invest unless you’re prepared to lose all the money you invest. This is a high-risk investment and you are unlikely to be protected if something goes wrong. Take 2 minutes to learn more
Litecoin Price Prediction – June 6
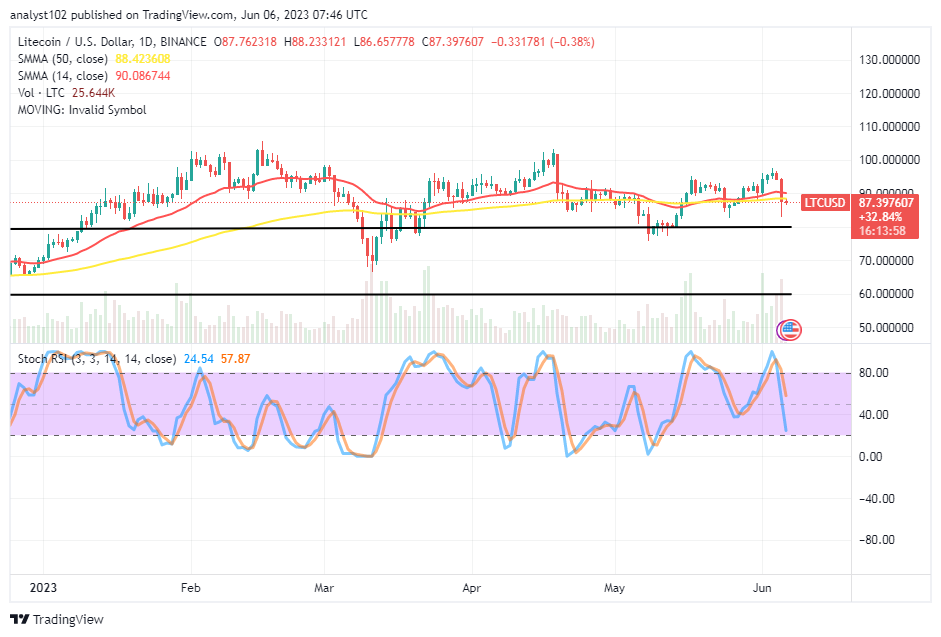
There has been a financial recording; showcasing the LTC/USD market responses to a decline beneath $95. In the last several hours of trading into this day, the transaction arenas have produced value lines between $88.233121 and $86.657778 with a minute negative percentage rate of 0.38. The obtainable fact remains that buying activities are to suspend until another trade pattern forms against seeing a bearish trending move. Bears lack the strength to forcefully push against those values that will systemically occur around $85 or in a continuation into the support zone of $80.
LTC/USD Market
Key Levels:
Resistance levels: $95, $100, $105
Support levels: $80, $75, $70
LTC/USD – Daily Chart
The LTC/USD daily chart reveals the crypto market responses to a decline beneath the $95 resistance level. Yesterday’s session witnessed a sharp-bearish trading candlestick passing through the SMA trend lines to denote that selling moments have had a prevailing bearish wall. The 14-day SMA indicator is at $90.086744 above the $88.423608 value line of the 50-day SMA indicator. The Stochastic Oscillators have crossed southbound from the overbought region to 57.87 to 24.54.
Will LTC/USD market activities continue to operate below the $95 resistance line for an extended time?
The formation of the bearish candlestick traded signals a formidable resistance point staged around $95 as the LTC/USD market responds to a decline beneath the value line. Technically, the $80 level is the fundamental support line that acts as the underlying trade line. It would also sound highly psychological to wait for an active bounce-off at the touch of the value line or another round of pattern characterized by a confluence between it and lower support points afterward before going for longing orders.
On the valuation-losing direction of the LTC/USD market, the involvement of the points of the SMA trend lines will be instrumental in the decision taken by bears around the $95 resistance line. That means sellers must maintain their positions by ensuring no velocity will stage to reverse northward against them. According to the Stochastic Oscillators’ reading, some falling scenarios have the propensity to surface right now. Takers of short positions should be cautious about entering the current declining motion.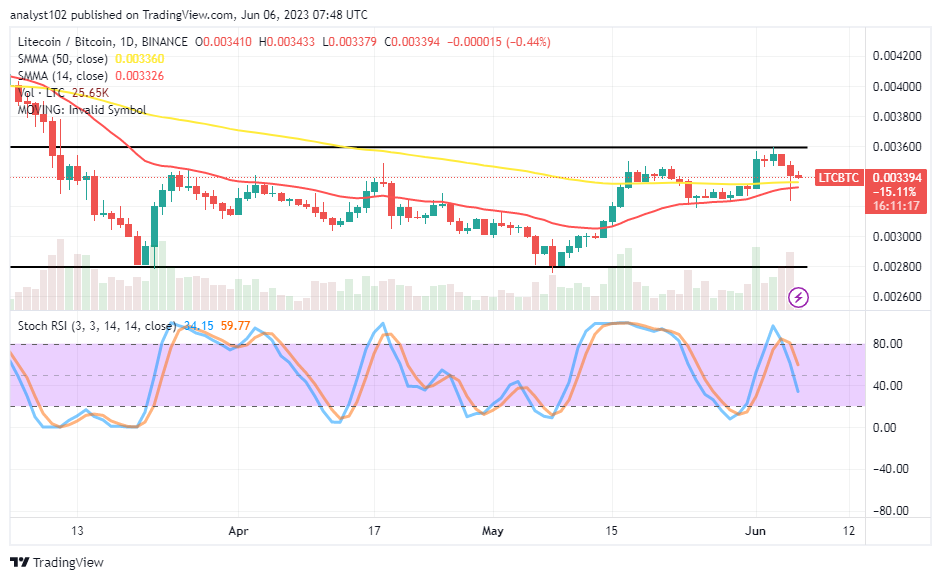
LTC/BTC Price Analysis
In contrast, Litecoin’s market operation responds to a decline beneath the resistance upper line against Bitcoin. The 14-day SMA trend line is closed underneath the 50-day SMA trend line. The Stochastic Oscillators have crossed southward from the overbought area to levels 59.77 to 34.15. The forces supporting the upcoming downward movements are comparatively waning, which will lessen their appeal to lower lows in the future.
Note: Cryptosignals.org is not a financial advisor. Do your research before investing your funds in any financial asset or presented product or event. We are not responsible for your investing results.
You can purchase Lucky Block here. Buy LBLOCK