Litecoin (LTC) Price Prediction: LTC/USDT Sustains Above the $70.00 Mark
Estimated Reading Time: 3 minutes
Don’t invest unless you’re prepared to lose all the money you invest. This is a high-risk investment and you are unlikely to be protected if something goes wrong. Take 2 minutes to learn more

Litecoin (LTC) Price Prediction: July 23
Ever since the Litecoin market failed to break the support at the $60.00 mark, price activity has retraced its way gradually upward. Nevertheless, the market hasn’t been able to move too far away from the support at the $70.00 price level.
LTC/USDT Long-term Trend: Bullish (Daily Chart)
Key Price Levels:
Resistance Levels: $80.00, $90.00, and $100.00
Support Levels: $65.00, $60.00, and $55.00
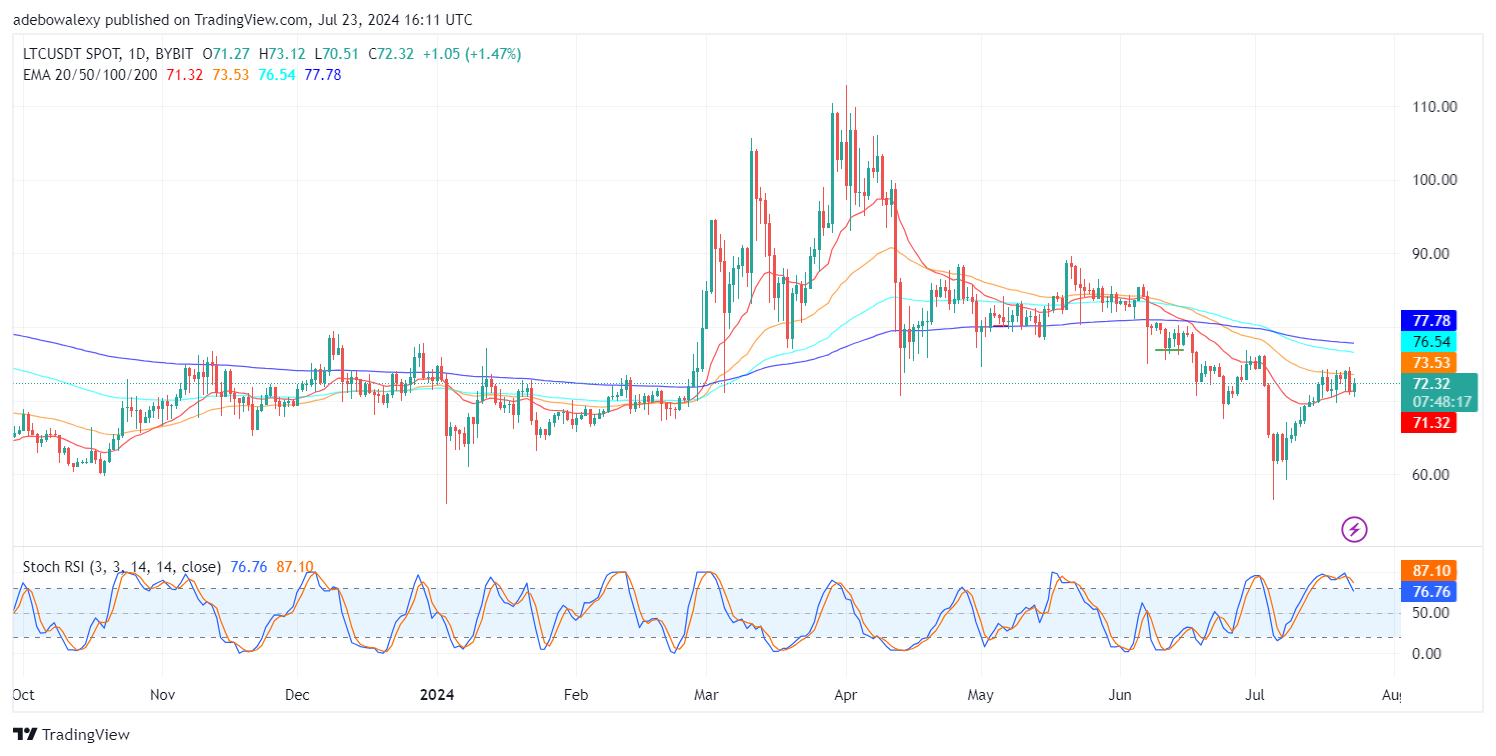
In the Litecoin daily chart, it appears that the 50-day Exponential Moving Average (EMA) line has presented a strong resistance. This opinion comes from the fact that this resistance level has held, and price activity has mostly been consolidating below that indicator line. Meanwhile, the ongoing session seems to be seated on the 20-day EMA line while it is still green. However, the Stochastic Relative Strength Index (SRSI) has already delivered a downward crossover and has arrived around the 80 mark of the indicator.
Litecoin Price Prediction: LTC/USDT Glides Above the $70 Threshold
As earlier stated, price activity in the Litecoin daily price chart hasn’t been able to rise significantly off the $70.00 price level. The market continues to trade just below the 50-day EMA line. And, although the ongoing session has seen some price increases, we can see that the corresponding price candle lies below the 50-day EMA curve. Additionally, it can be seen that the Stochastic Relative Strength Index (SRSI) lines on the chart have a downward trajectory.
Consequently, it can be deduced that price action in the market lacks the needed push from market participants. However, a breakthrough of the 50-day EMA line may signal the readiness of this asset to extend the upside corrections.
LTC/USDT Medium-term Trend: Litecoin Price Action Experiences a Contraction (4H Chart)
Price action in the LTC/USDT market can be seen to have risen above three out of four of the EMA indicator lines. Nevertheless, the EMA lines seem to house all the more recent price candles. We can observe that these price candles have converged yet house price movement. The ongoing session has produced minimal downward corrections. Also, the SRSI lines can be seen sticking to an upward trajectory as they rise out of the overbought region.
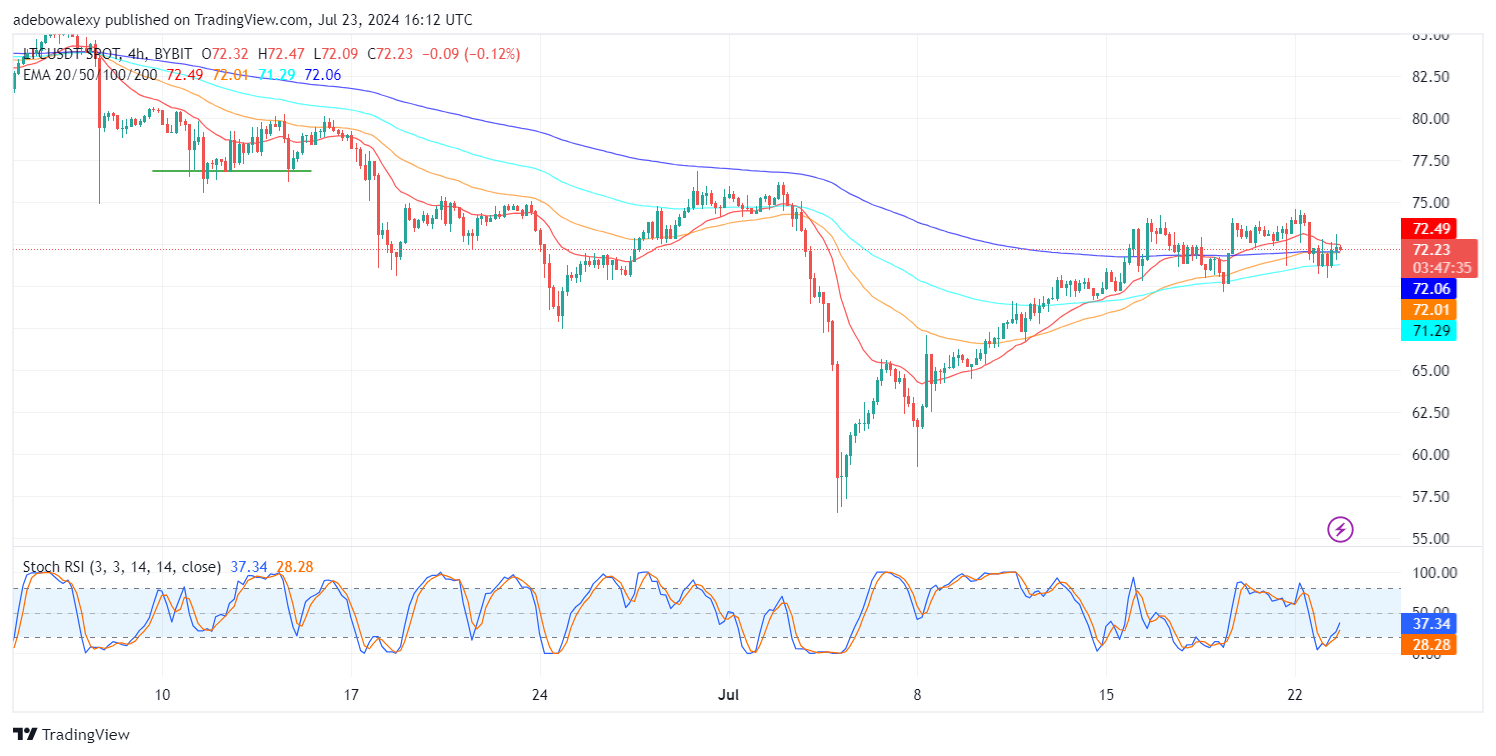
The contractions seen on the technical indicators and the trajectory of the SRSI indicator lines hint at the possibility of a breakout towards the $80 price level. However, traders should take the necessary precautions for safety while making such speculations.