Lucky Block (LBLOCK) Price Analysis: Positive Momentum Brewing?
Estimated Reading Time: 3 minutes
Don’t invest unless you’re prepared to lose all the money you invest. This is a high-risk investment and you are unlikely to be protected if something goes wrong. Take 2 minutes to learn more

Lucky Block (LBLOCK) is currently trading at $0.00001406, reflecting a slight dip of 1.95%. Despite this minor pullback, the token’s charts indicate the potential for upcoming bullish momentum, supported by technical indicators and patterns on both the 4-hour and daily charts.
4-Hour Chart: Steady Consolidation with Bullish Signals
The 4-hour chart for LBLOCK/USDT shows the price consolidating within the Keltner Channel (KC), which suggests a period of accumulation. The current range between $0.00001209 and $0.00001738 provides a clear support-resistance zone.
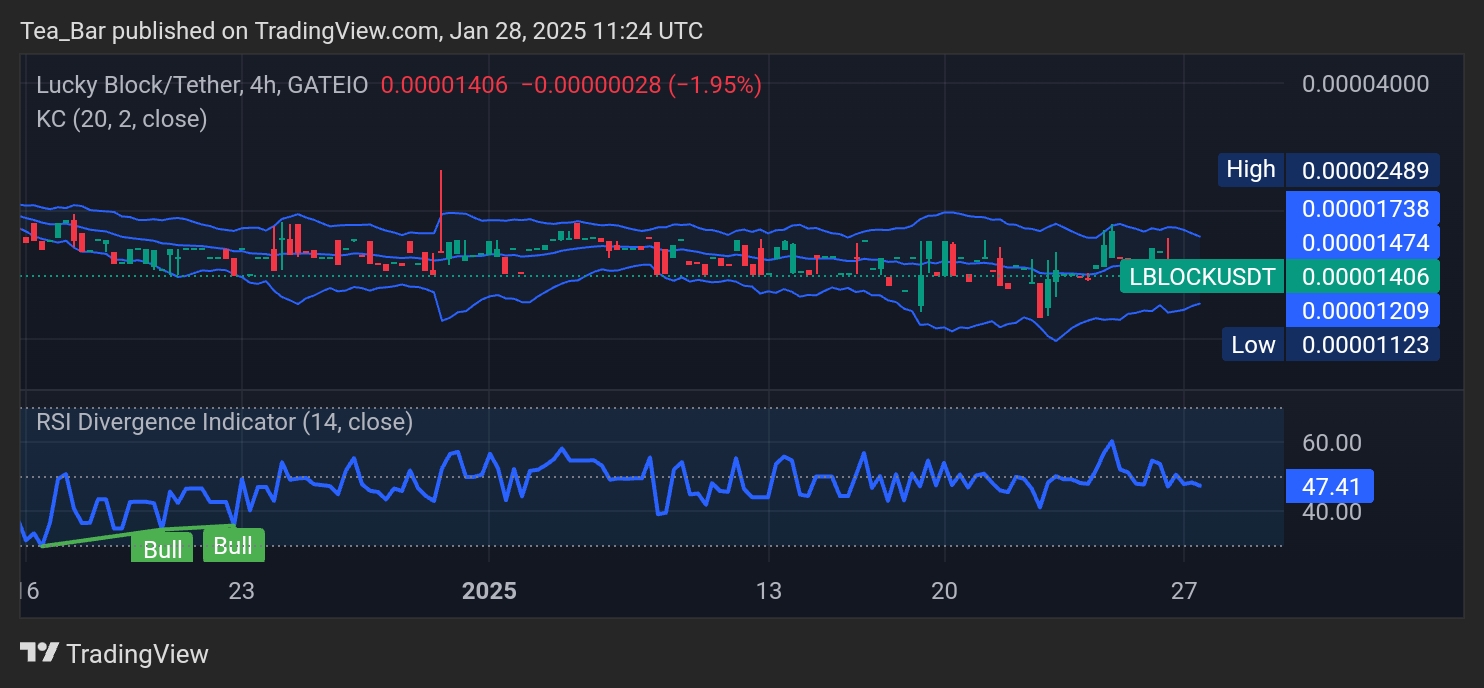
The Relative Strength Index (RSI) stands at 47.41, slightly below the neutral 50 mark. However, bullish divergence signals are present, hinting at growing buying pressure. Past divergences on the 4-hour chart have successfully predicted short-term rallies, and this pattern could repeat if upward momentum builds.
Daily Chart: Room for Upside Breakout
Examining the daily timeframe, the token remains within the boundaries of the Keltner Channel, with strong support near $0.00001000 and resistance around $0.00001999. This relatively tight trading range indicates market participants are awaiting a breakout.
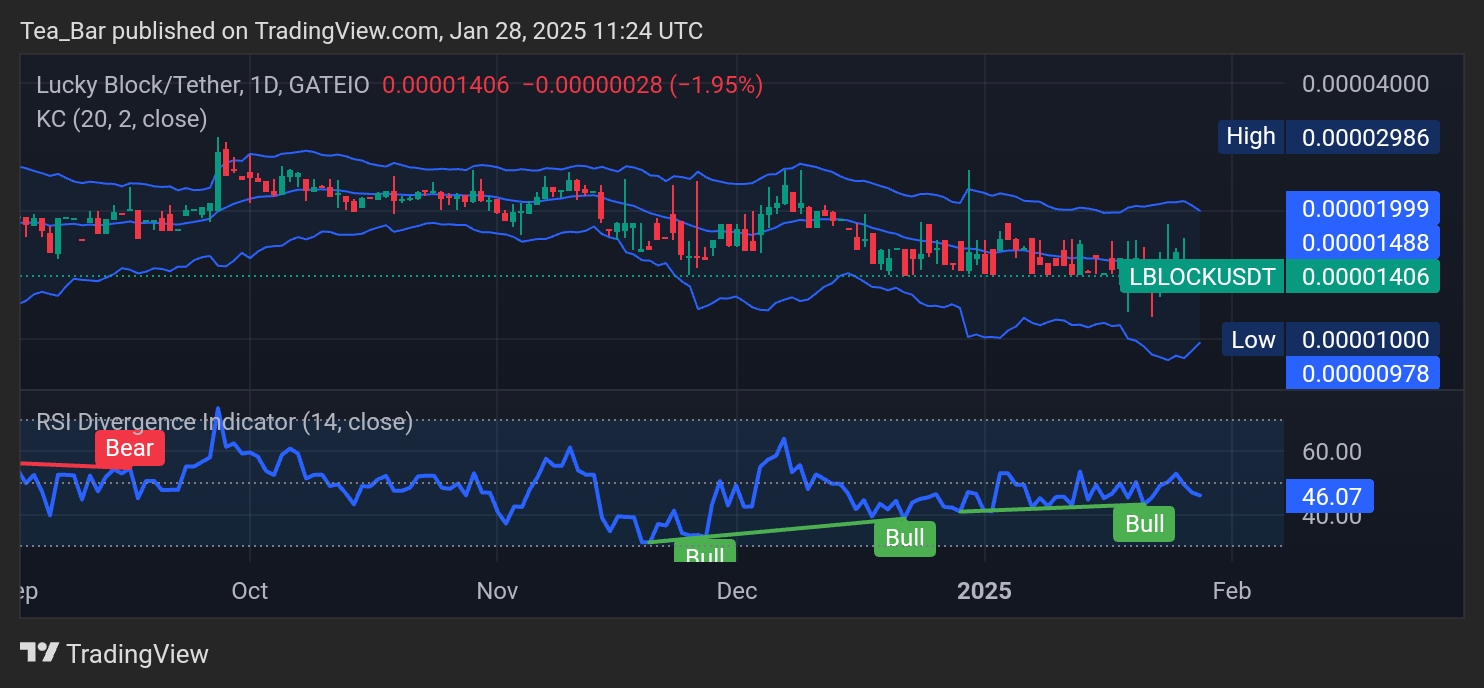
The RSI on the daily chart reads 46.07, aligning with gradual upward trends. Additionally, a bullish RSI divergence from late December persists, further supporting the possibility of a trend reversal. The token’s stability within this range showcases resilience, especially in the face of broader market volatility.
Future Outlook: Can LBLOCK Gain Momentum?
Lucky Block’s ability to maintain support levels and form bullish divergences on multiple timeframes suggests the potential for upward movement. Breaking above the key resistance of $0.00001488 could open the path to $0.00001738 and higher, creating opportunities for short-term traders.
Looking ahead, LBLOCK’s fundamentals, combined with technical signals, create an optimistic backdrop. As accumulation continues, investors may witness a breakout scenario, potentially marking the start of a more substantial upward trend.
You can purchase Lucky Block here. Buy LBLOCK.