Riding the Wave: Is Lucky Block (LBLOCK) Gearing Up for a Breakout?
Estimated Reading Time: 2 minutes
Don’t invest unless you’re prepared to lose all the money you invest. This is a high-risk investment and you are unlikely to be protected if something goes wrong. Take 2 minutes to learn more

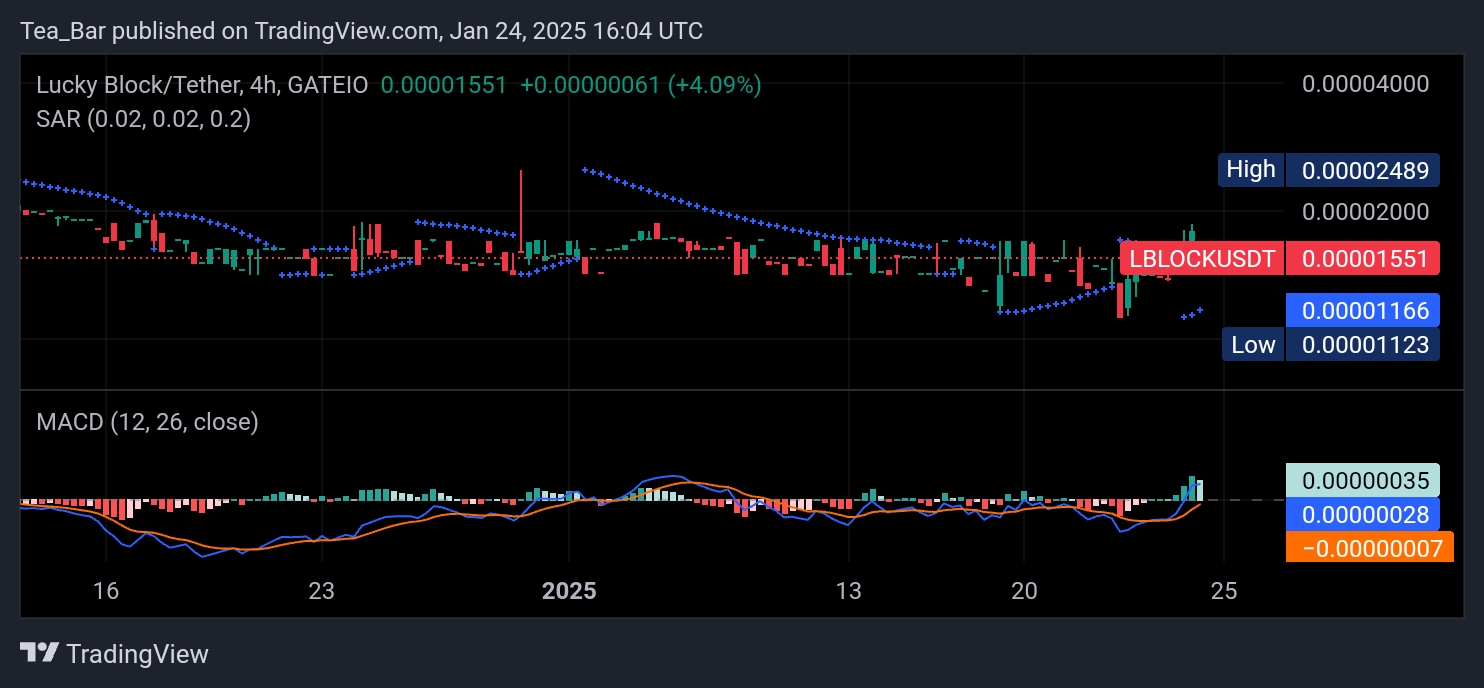
Lucky Block (LBLOCK) has demonstrated a remarkable recovery, as seen on the daily and 4-hour charts. Currently trading at $0.00001551, LBLOCK has surged by 4.09% in the last session, reflecting renewed buying interest.
The Parabolic SAR indicator signals a potential bullish trend, with the dots appearing below the price candles. This suggests growing momentum in favor of buyers. Simultaneously, the MACD histogram showcases a positive shift as the MACD line moves above the signal line, accompanied by rising green bars, a clear indicator of bullish sentiment.
Can Lucky Block Sustain Its Upward Momentum?
On the 4-hour chart, the price is approaching resistance at $0.00002489, a crucial level to watch for continued upward movement. A successful breakout above this level could propel LBLOCK to test the $0.00002986 resistance zone. Meanwhile, the immediate support rests at $0.00001166, safeguarding the token from significant downside risks.
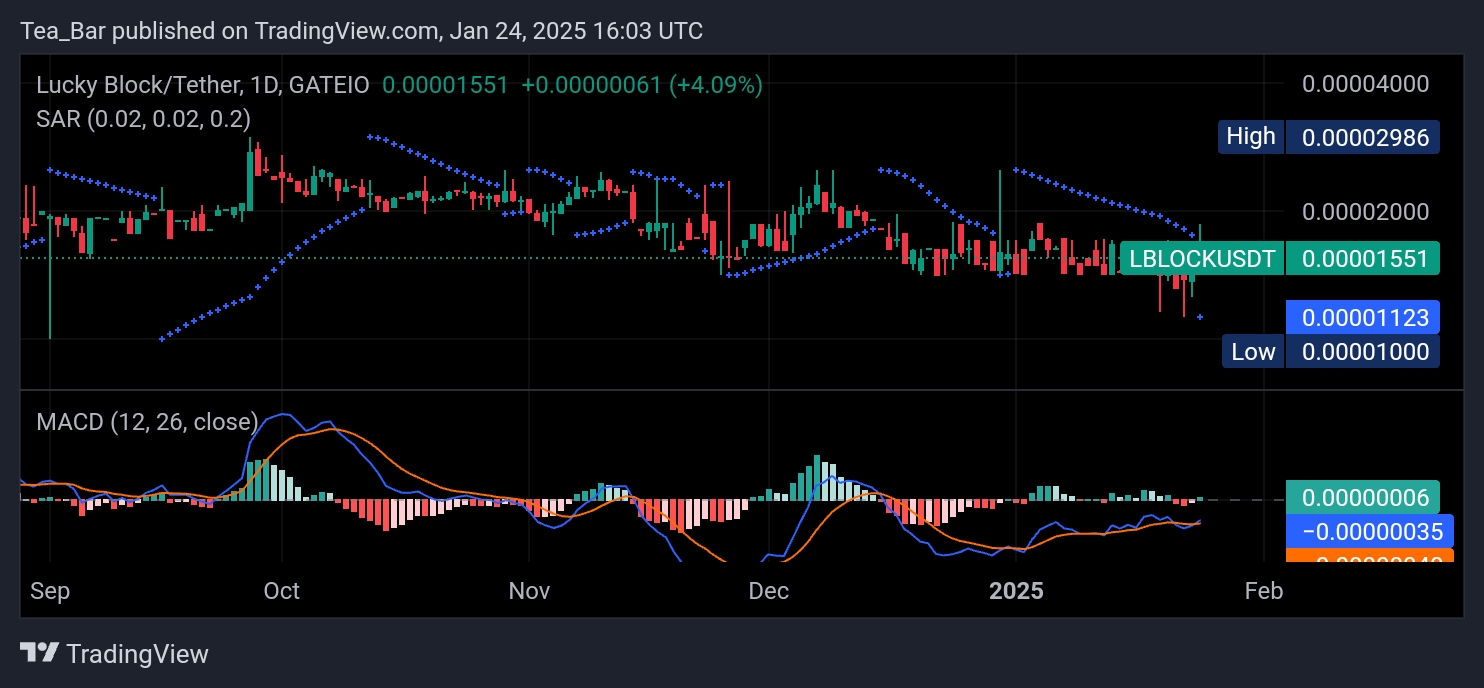
The 1-day chart further highlights the token’s resilience, with its low at $0.00001000 reinforcing the strength of the support zone. The consistent rise in trading volume indicates increasing participation, potentially laying the groundwork for sustained growth.
Lucky Block’s current trajectory signals optimism, making it an attractive prospect for both short-term traders and long-term holders. Should this bullish momentum persist, LBLOCK could continue to surprise the market with steady gains.
You can purchase Lucky Block here. Buy LBLOCK.